This functionality introduces a new specific dashboard for supplier management within GlobalSuite®, aiming to centralize the visualization of key metrics related to suppliers, surveys, and tickets. Through visual indicators, detailed tables, and advanced filters, this dashboard enables comprehensive and dynamic tracking of the status of third-party relationships, facilitating decision-making and operational control.
TPRM Tab – Supplier Data
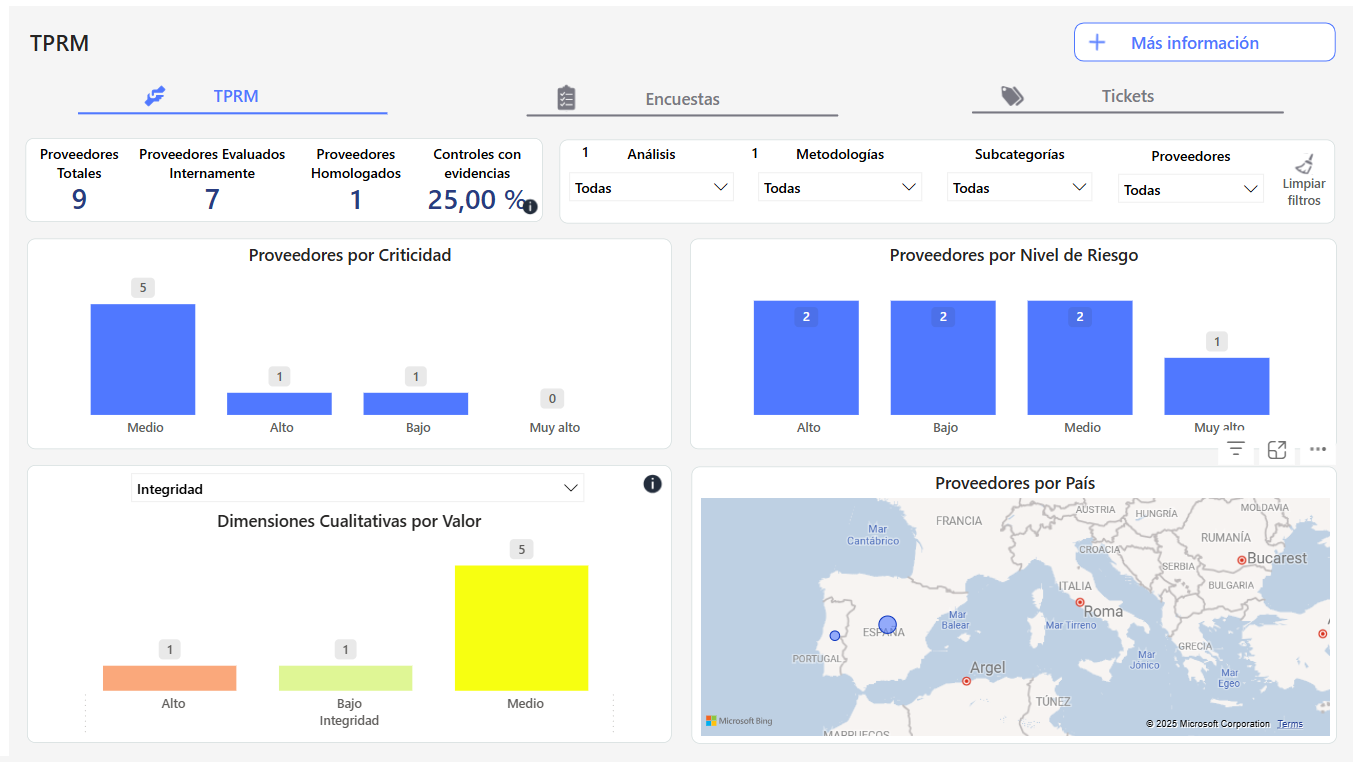
Key Indicators
-
Total Suppliers: Displays the total number of suppliers registered in the system, regardless of their evaluation status or whether they have been created as associated elements or not.
-
Internally Evaluated Suppliers: Indicates the number of suppliers that have undergone a criticality evaluation in the Element Table.
-
Approved Suppliers: Reflects the number of suppliers with a risk assessment associated with a specific service. That is, suppliers with associated services, in Home > Suppliers, whose services have the RGE calculated.
-
Controls with Evidence: Indicator showing the percentage of controls associated with suppliers that have documented evidence.
Visualizations
-
Suppliers by Criticality: Bar chart showing the distribution of suppliers according to their level of criticality.
-
Suppliers by Country: Interactive map visualizing the geographical location of suppliers, with volume indicators.
-
Qualitative Dimensions by Value: Visualization presenting the distribution of qualitative dimensions assigned to suppliers, using inventory valuation.
-
Suppliers by Risk Level: Bar chart classifying suppliers according to their risk level, using the RGE valuation from the risk analysis.
More Information Tables
-
Controls with Evidence: Table with Supplier, Criticality, Control, Type, and Evidence.
-
Supplier Data Details: Table including detailed information such as country, subcategory, criticality, risk level, associated evidence, and date of the last evaluation.
Advanced Filters
-
Allows applying filters by methodologies, analyses, subcategories, survey models, and suppliers, offering complete customization of data visualization.
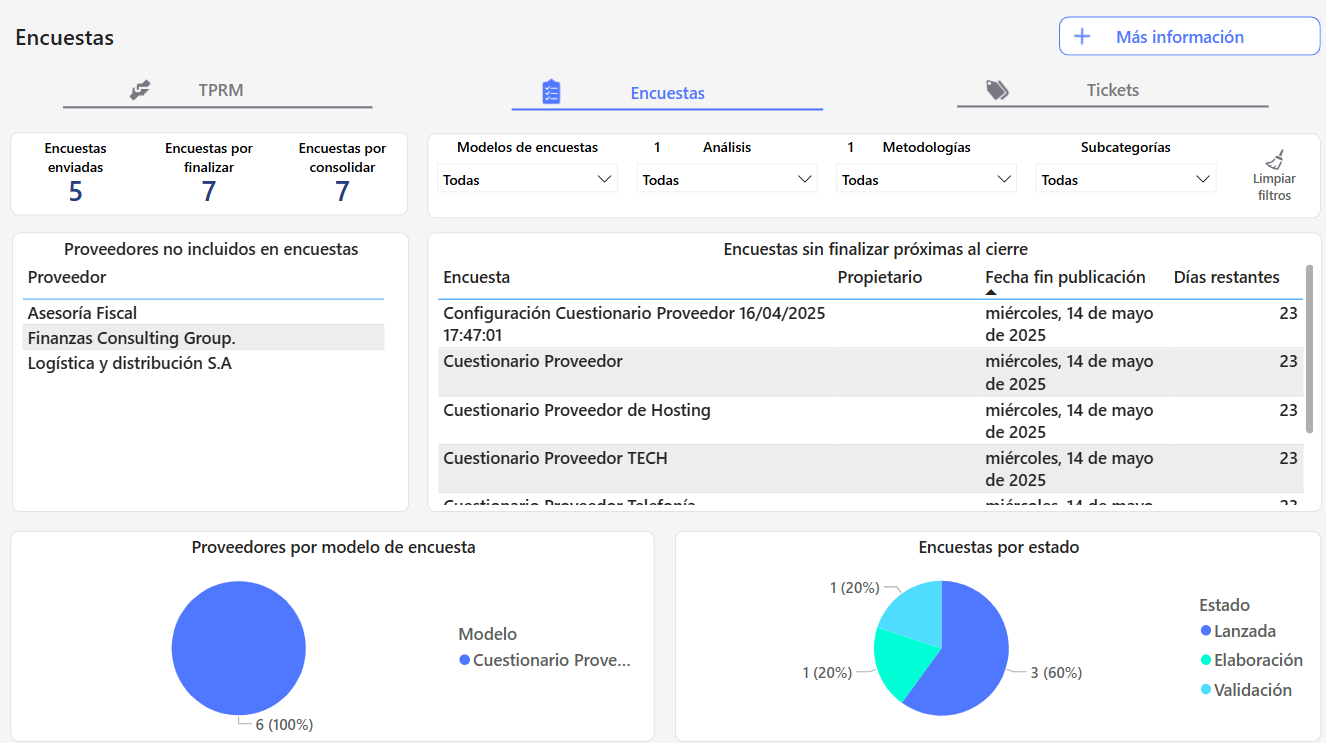
Surveys Tab
Visualizations
-
Indicators: Displays metrics such as the number of questionnaires sent, pending completion, and pending consolidation.
-
Charts: Includes visual representations such as "Suppliers by Survey Model" and "Surveys by Status".
Detailed Tables
-
Survey Data: Includes information such as supplier, country, survey, responsible party, owner, launch date, end of publication date, and status.
-
Unfinished Surveys Near Closure: List of questionnaires nearing their completion date that have not yet been completed.
-
Suppliers without Assigned Surveys: Identifies suppliers without associated surveys.
Advanced Filters
-
Allows applying filters by surveys, configuration, launch date, end of publication date, and supplier, offering complete customization of data visualization.
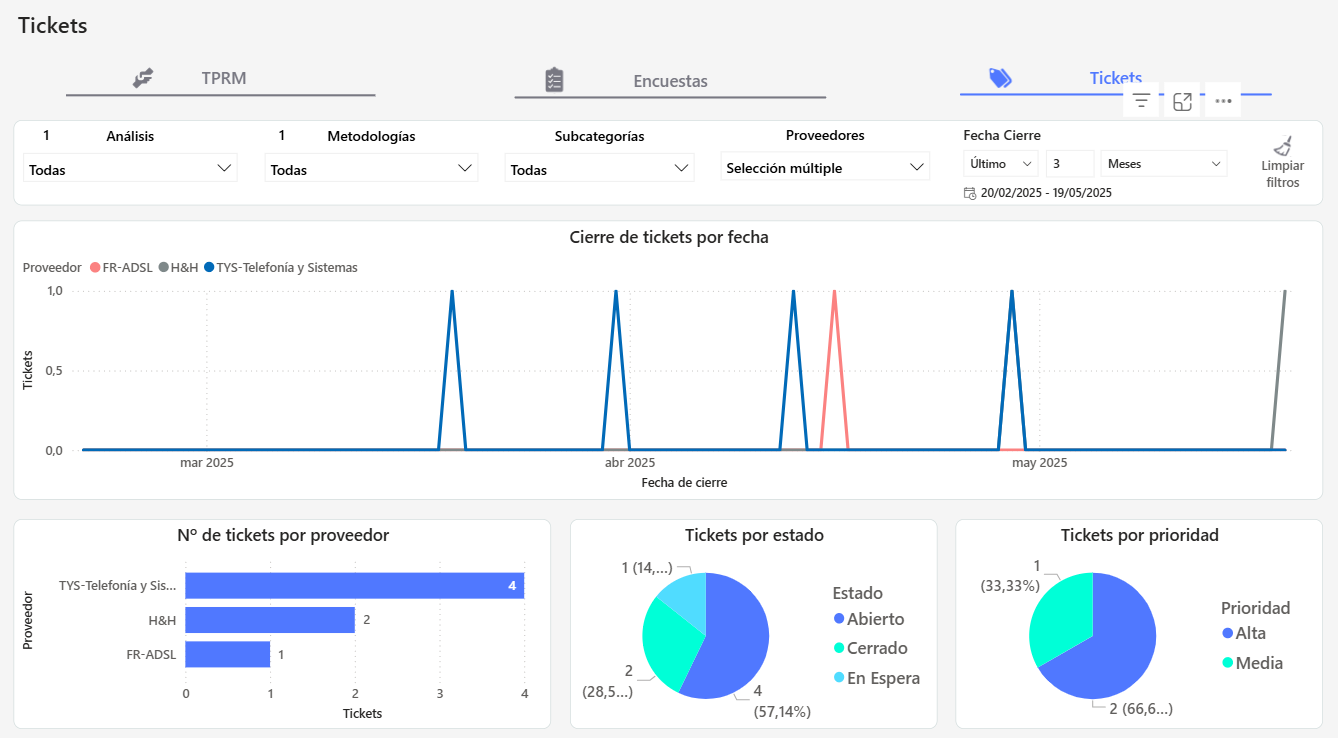
Tickets Tab
Visualizations
Charts: The following visualizations will include tickets that have associated suppliers (SUPPLIER field:).
-
Ticket Closure by Date: Displays tickets with a defined closure date in the ticket (DATE field, type expected closure date).
-
Number of Tickets by Supplier: Includes tickets that have the SUPPLIER field and an associated supplier.
-
Tickets by Status: Includes tickets that have the STATUS field and a selected status.
-
Tickets by Priority: Includes tickets that have the PRIORITY field and a selected priority.
Advanced Filters
-
Allows applying filters by tickets, expected closure date, and priority, offering complete customization of data visualization.