This tutorial explains, step by step, how to create, plan, and execute a Testing Program in GlobalSuite®, within the Business Continuity module.
Once the BIAs and Recovery Plans (DRP) are defined, the “Testing Program” option is available, which allows simulating recovery plans. However, it does not necessarily have to be the entire plan; it can also be individual sequences to ensure those sequences are well-defined. In other words, it is not a simulation of a recovery plan but rather testing different sequences to verify their correct functionality.
A test can be planned over time, such as throughout the year, quarter, semester, and so on. To access this option, go to Plans > Testing Program.
Phases for configuring the testing program
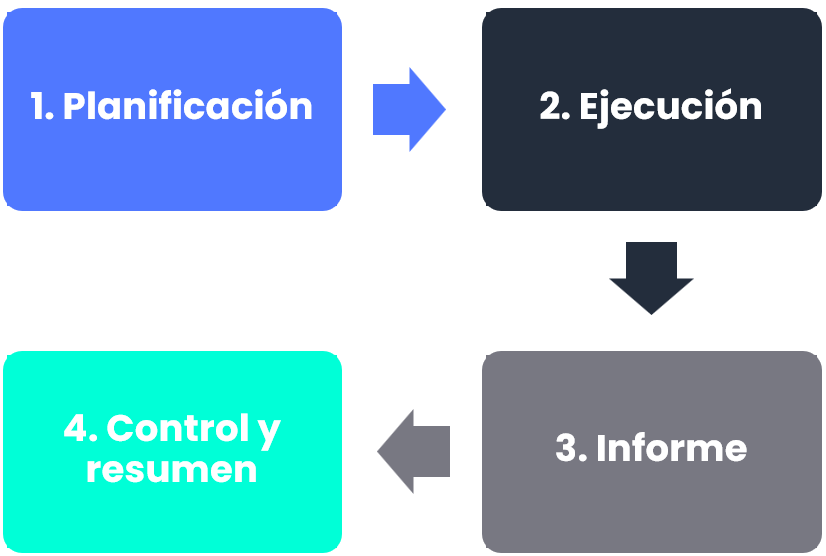
Planning
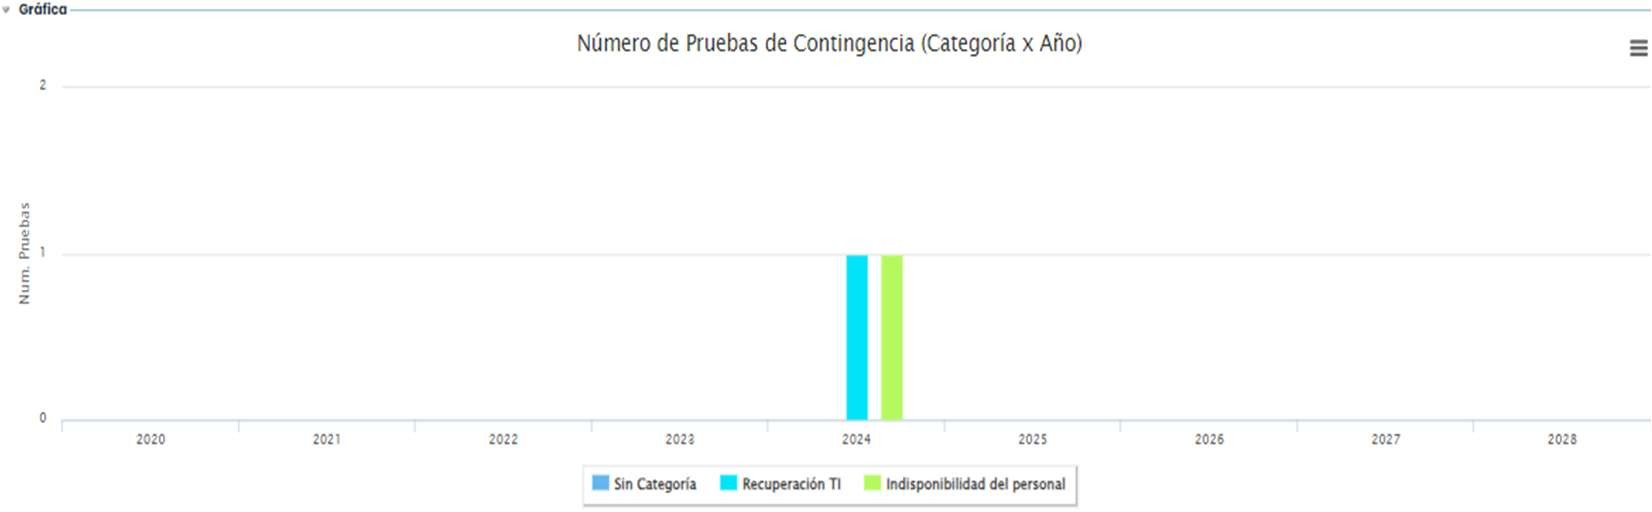
When entering the “ Testing Program ” option, both the graph, which is an annual timeline where different plans can be defined, and the list of completed tests appear.
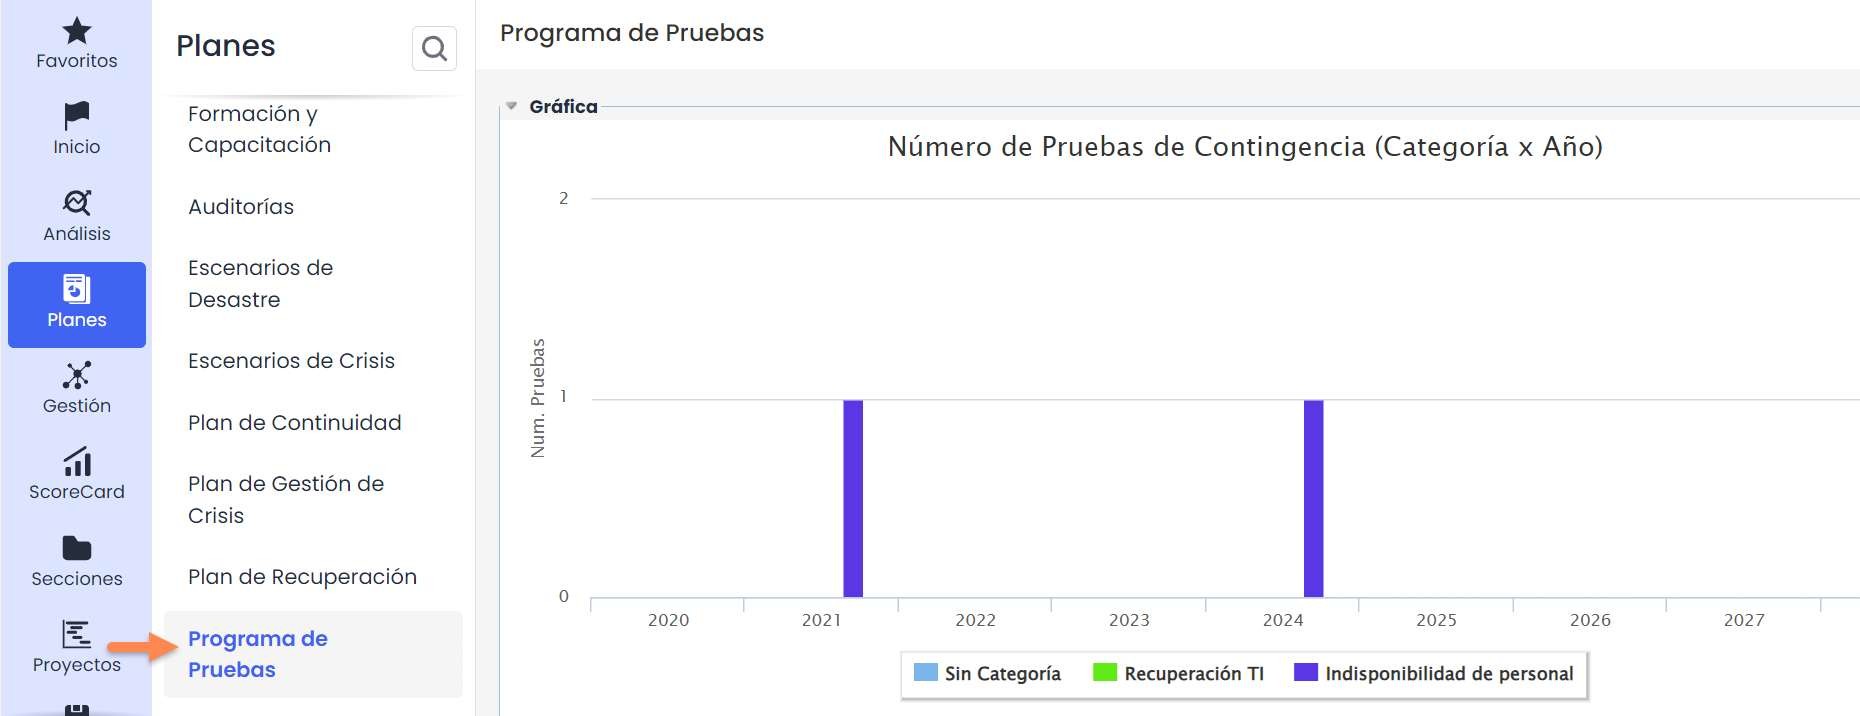
At the bottom of the graph, you can see that in this example, some categories are already defined. These categories are defined in Settings > Continuity > Plans > Continuity Test Categories
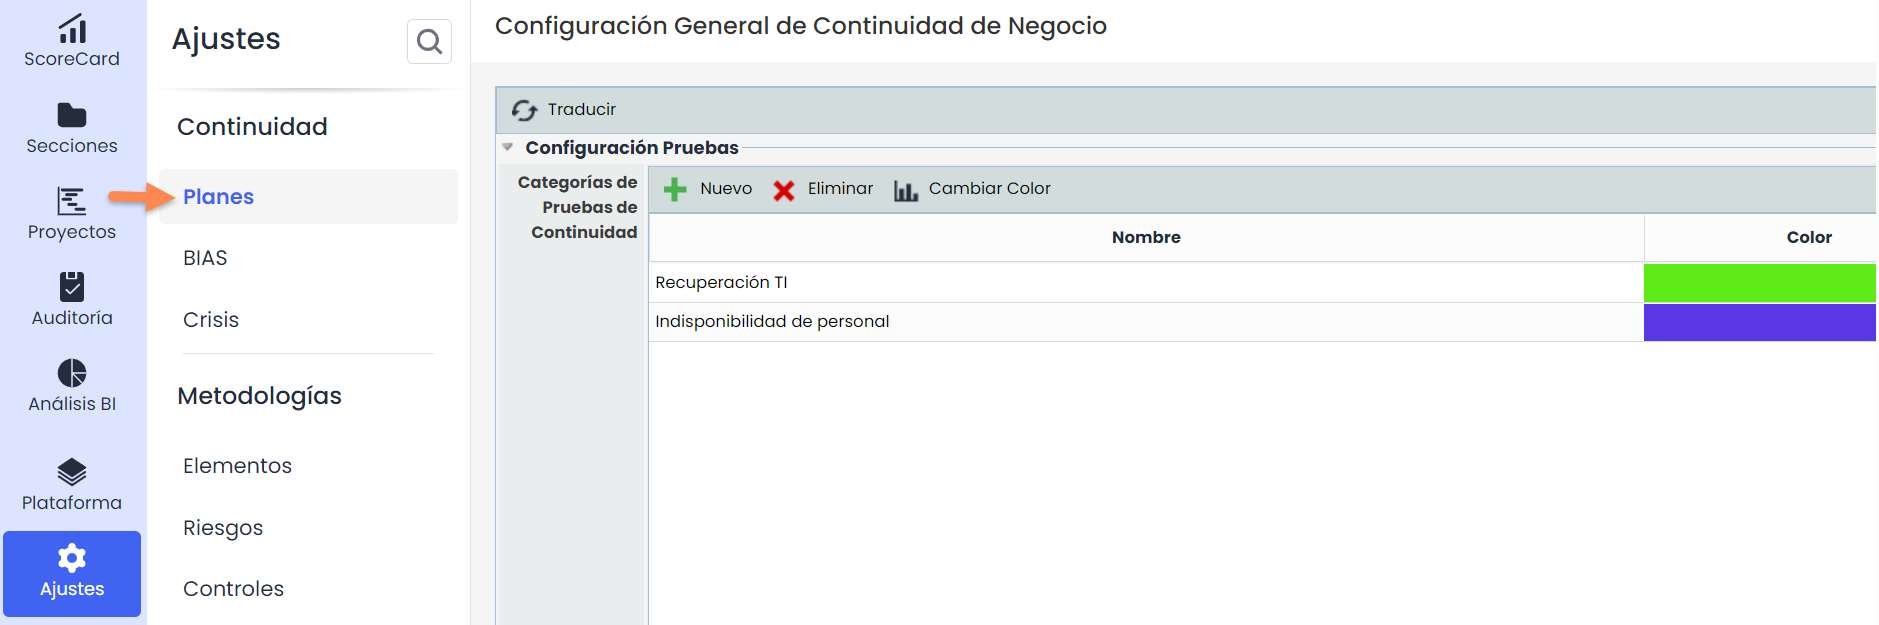
In this option, different categories can be created and assigned a color. This color will appear on the graph on the main screen of the “Testing Program.”
Once the categories are defined, return to Plans > Testing Program .
To create a new testing program, click the “ New” button, and a blue link will appear, which opens a form to fill out.
When accessing the test, there are three submenus:
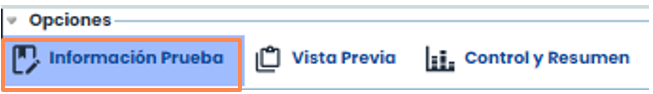
To plan and execute the testing program, use the first tab “Test Information” (the default option).
When entering the form, the first section observed is as follows:
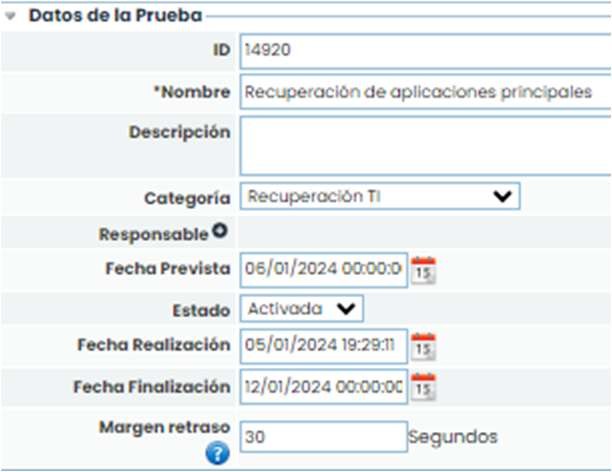
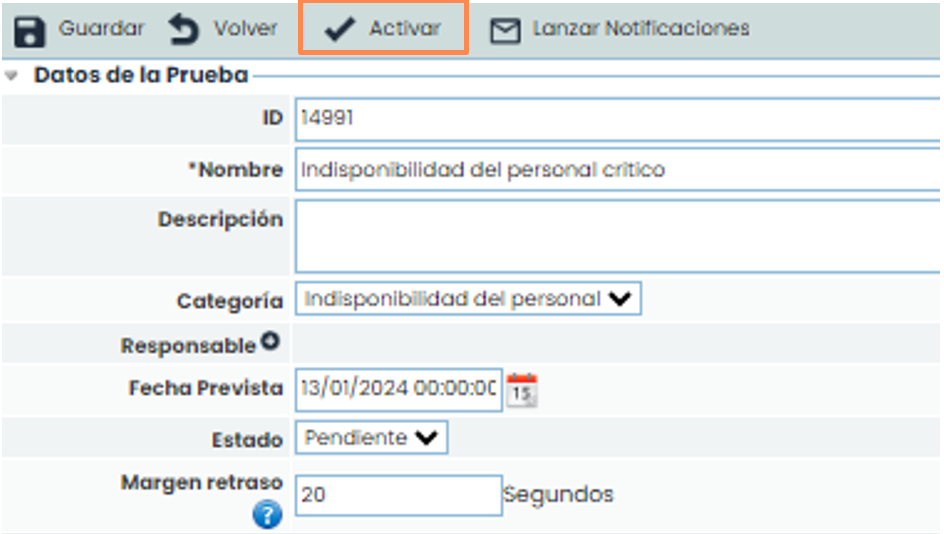
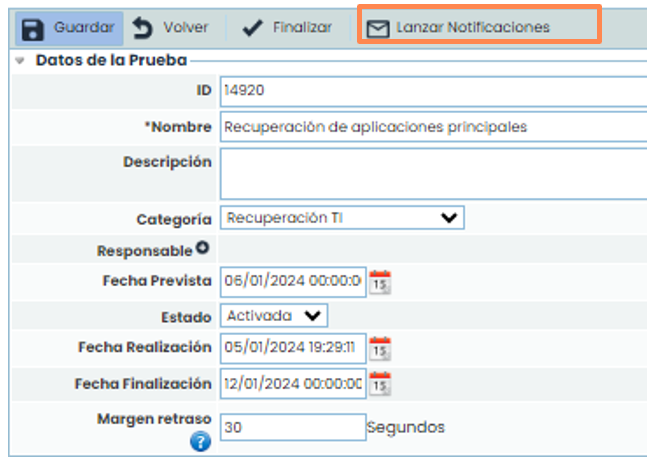
In this form, the name of the test is defined, and its description can be added. Additionally, the category it belongs to and a person responsible for the test are defined. A planned execution date for the test and its current status are also defined.
This status will automatically change when the test is activated.
Additionally, the delay margin is defined, which is the time allowed as a margin or delay between each task to start.
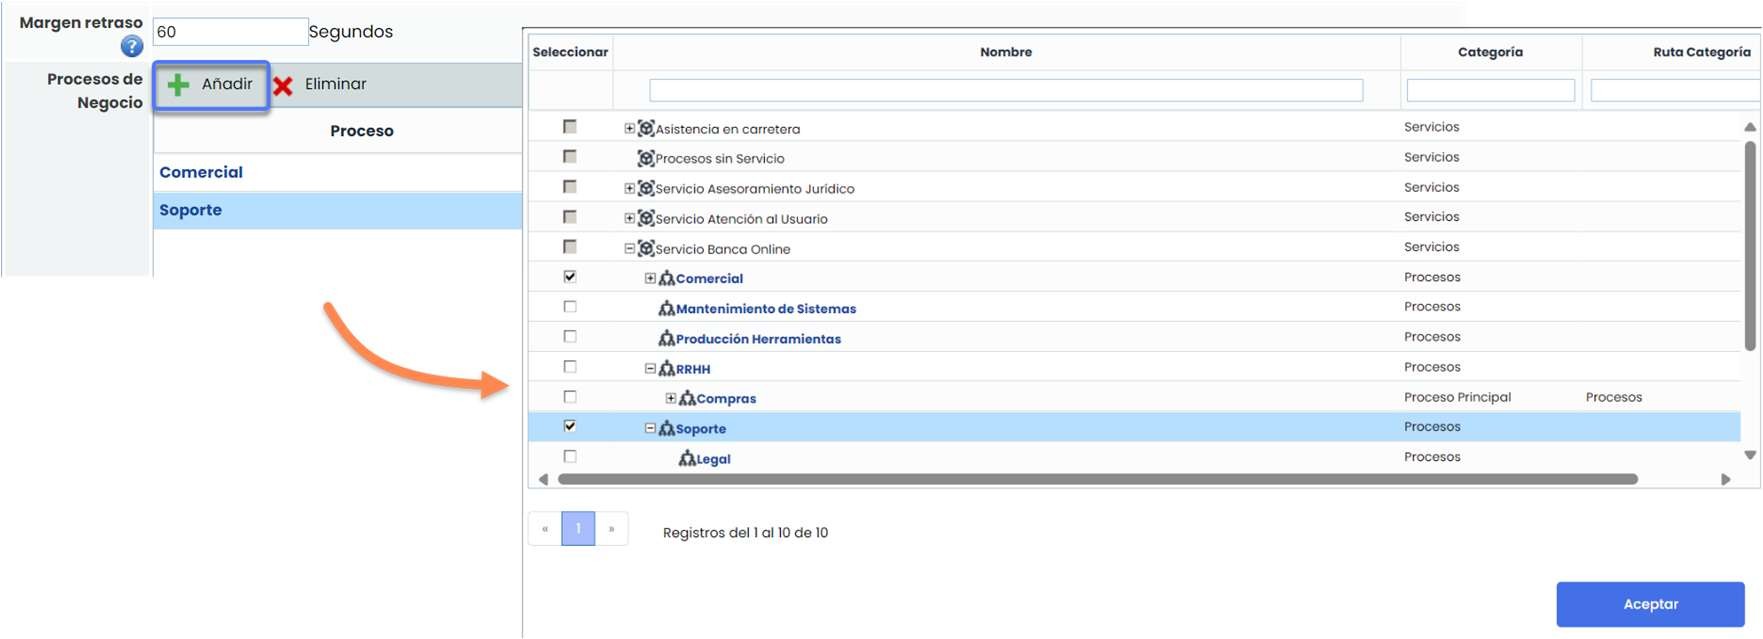
Additionally, there is the Business Process field, which allows associating processes within the testing cycle.
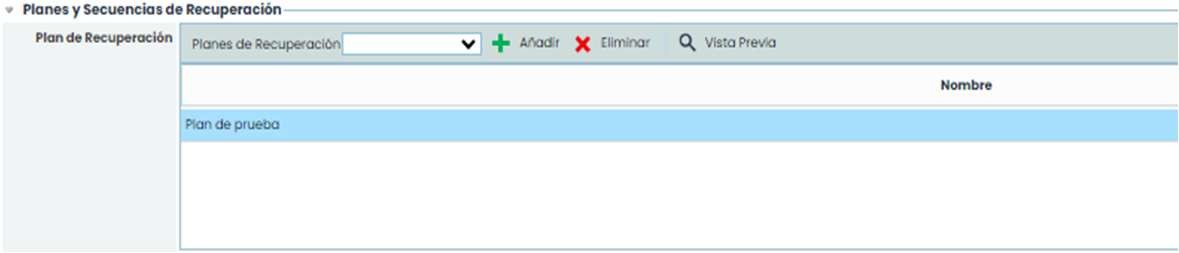
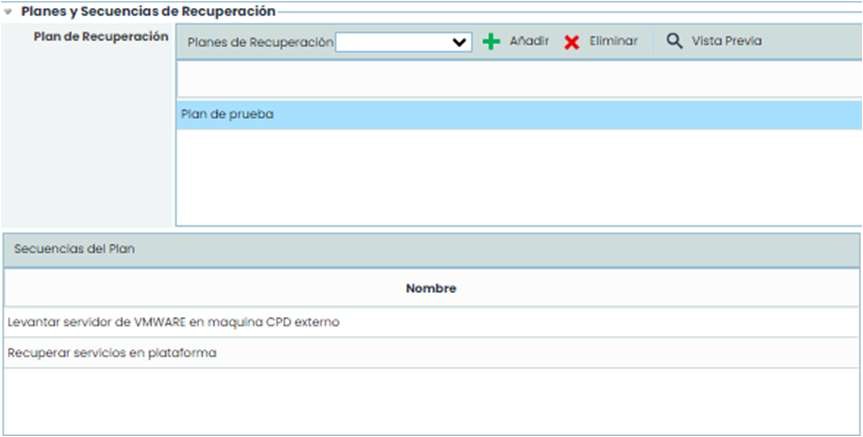
Once the first part of the form is defined, proceed to select the recovery plan on which the tests will be conducted. More than one plan can be selected at a time. To select them, click on the dropdown menu “Recovery Plans,” select the desired plans, and click “ Add.”
When selecting the recovery plan(s), the sequences with their different tasks, as previously configured in the “ Recovery Plans” option, will appear. To view these sequences, click on the plan for which you want to see the sequences.
By clicking on each sequence of the plan, in the box on the right, in the dropdown menu “ Previous Sequences,” you can select the sequences that precede the selected sequence.
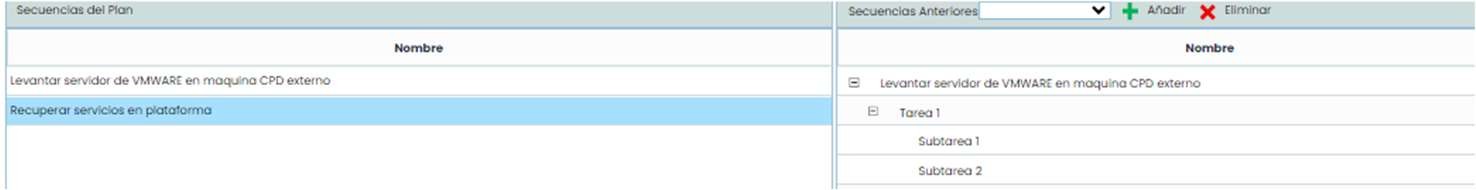
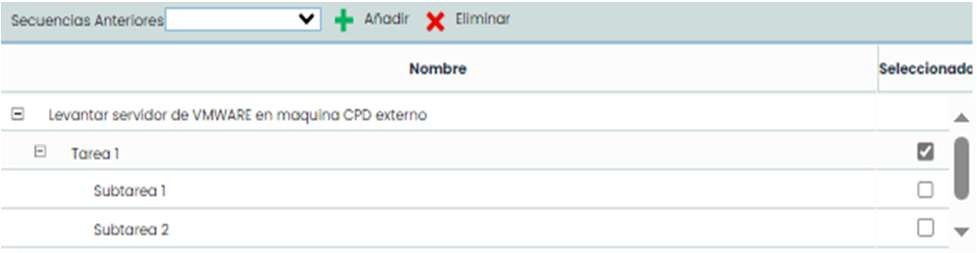
Within the “ Previous Sequences” box, you can also select the task or entire sequence after which the selected sequence in the left option must be performed.
Once the recovery plan is selected, the sequences to be tested must be chosen. This test can be conducted on the entire plan (all sequences and tasks) or only on some of them, meaning the entire plan does not have to be tested.
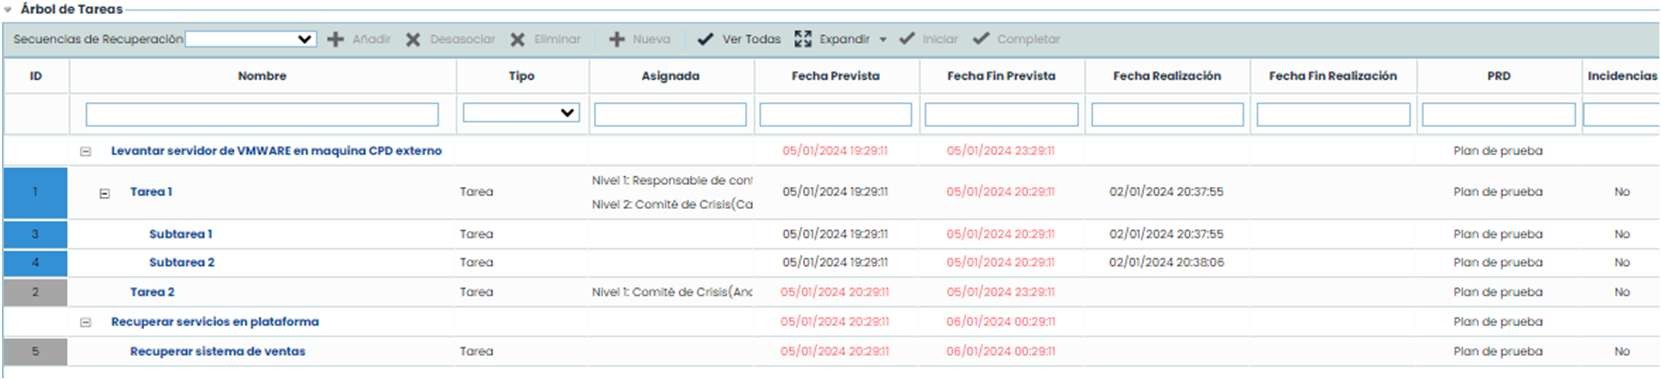
This is selected in the form, in the next option, which is the “ Task Tree.”
In the dropdown menu that appears under “ Recovery Sequences,” the sequences to be tested will be chosen. If any sequence added is not to be tested, it can be removed. Additionally, new sequences can be created using the “ New” button.
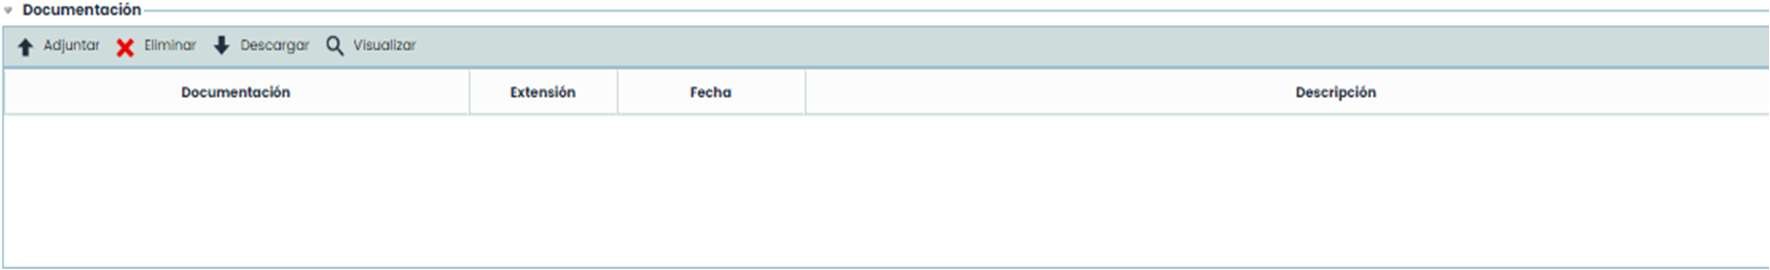
Additionally, any documentation related to the execution of the test can be attached. This documentation can be attached from files stored locally on the PC.
After completing the form, select “ Save.”
If you return to the previous screen, that is, the main screen, you can see that this newly planned test will appear on the graph.
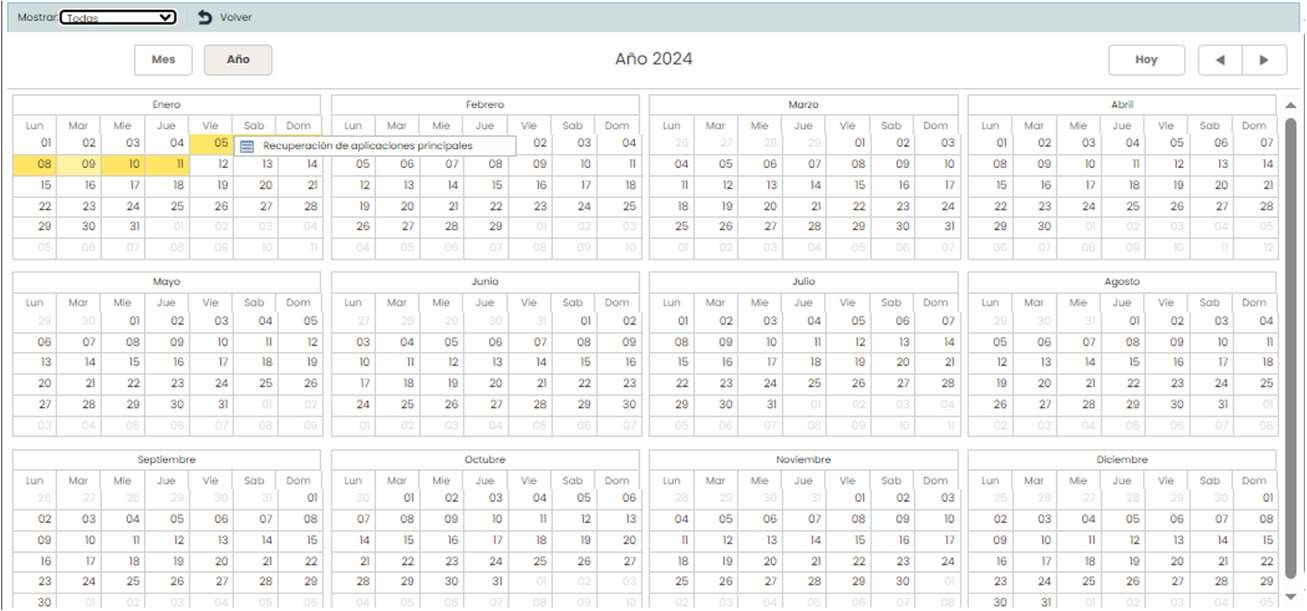
Additionally, if you click on the “ View Calendar” button, a calendar will open, marking the current day in yellow and the days when different tests have been planned and conducted.

In the “ Show” option, you can filter which ones you want to see: all, planned, conducted.
Execution
After creating and planning the test, the next step is to execute it. To do this, enter the test you want to conduct and click the “ Activate” button.
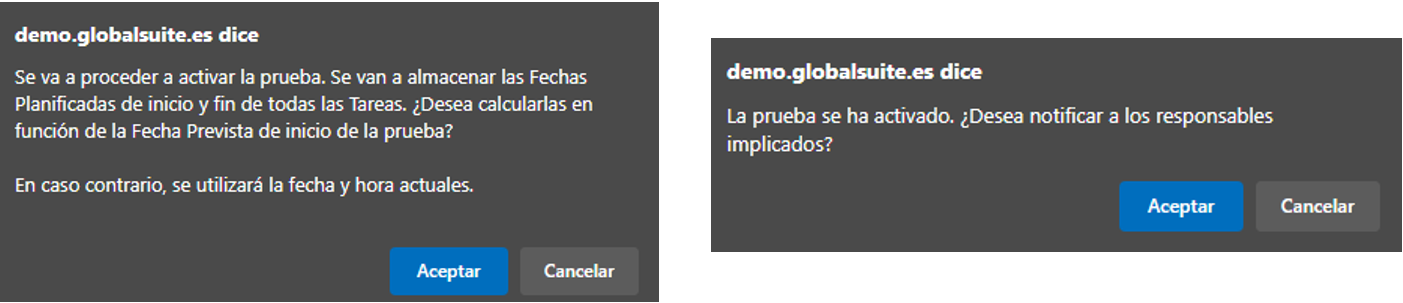
Next, two pop-ups will appear asking if you are sure you want to activate it and if you want to notify the activity managers.
By agreeing to send notifications, a table with different information about the managers will open. In this option, you can select whether to send the notification to all employees or only to some of them who have the option enabled to be selected in the “ Send” column.
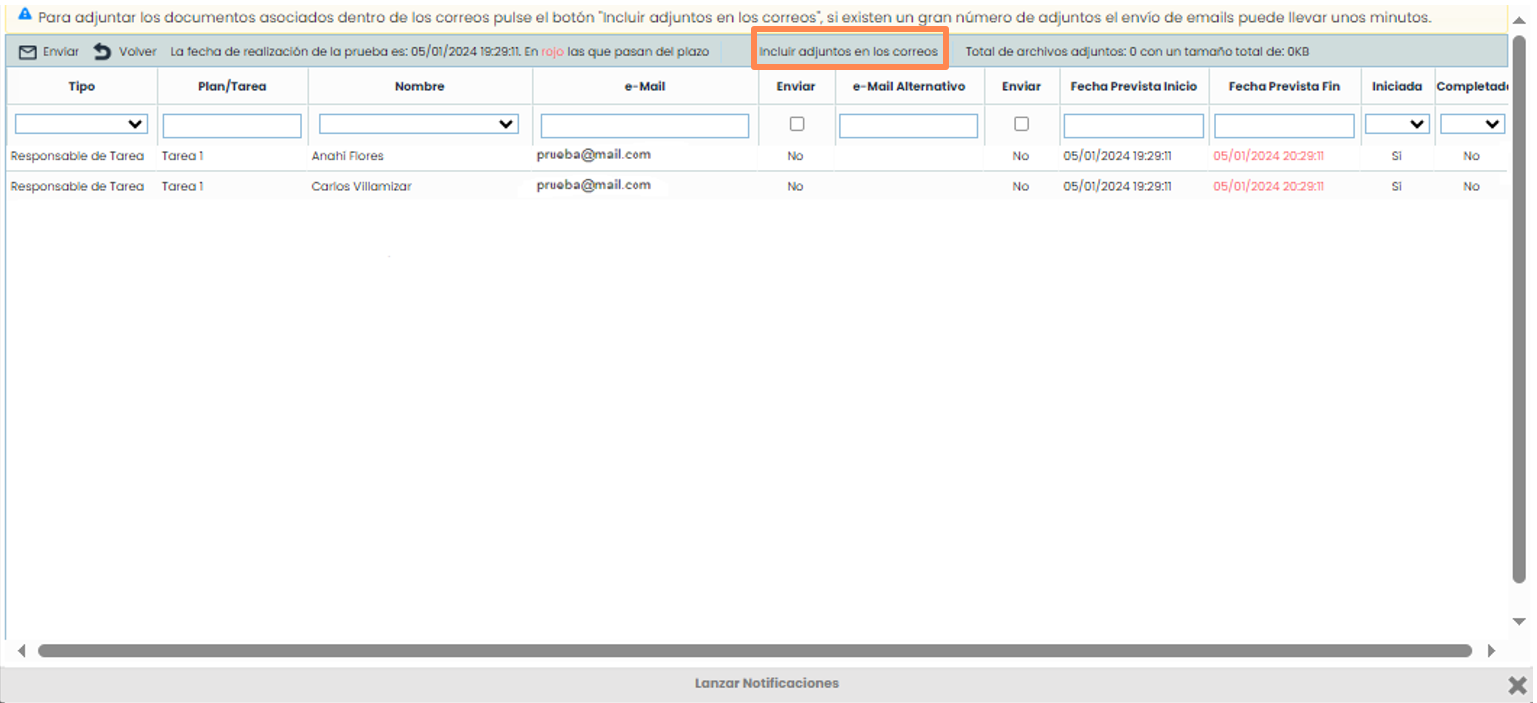
Additionally, you can attach the documentation associated with each task in the email by clicking the “ Include attachments in emails” button.
Once the previous steps are completed, if you agree to notify the managers, the selected managers will be notified via email. If you chose not to notify the managers, this can be done later by clicking the “ Launch notifications” button.
This button can also be used to resend a notification that was previously sent, meaning it is not only for cases where notifications were not sent but also to remind the managers again.
The managers can start the tasks they need to perform at the moment they are going to undertake them. The Test Manager can also perform this action.
To do this, click the “ Start” button when starting the task, and once completed, click the “ Complete” button.
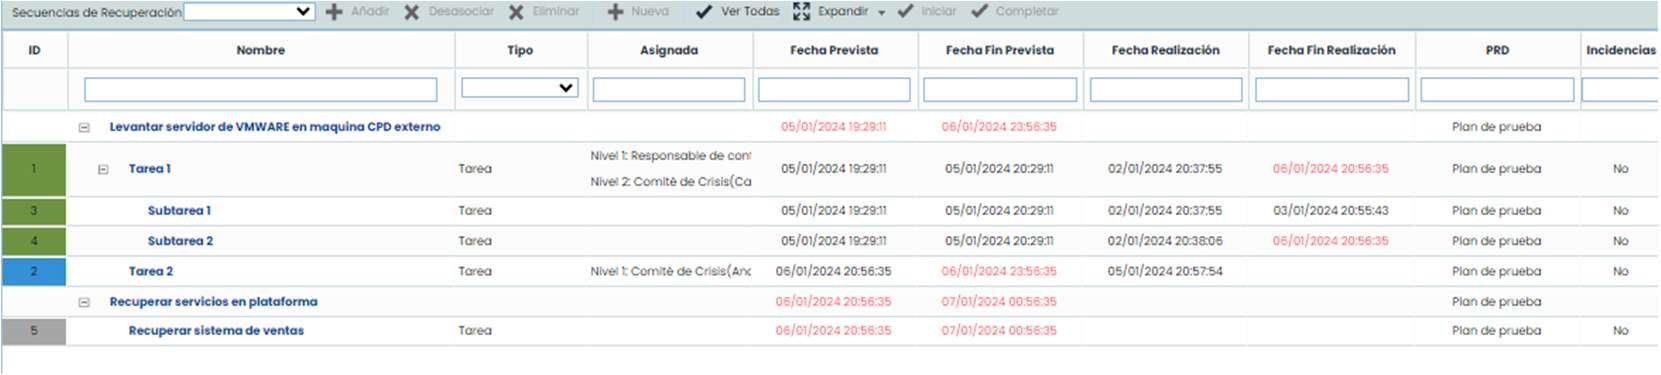
Tasks in blue are in progress, red indicates overdue tasks, gray are tasks not yet started, and green are completed tasks.
This allows collecting real information about the duration of the different tasks.
When all tasks are completed, the test must be finalized. This is done through the “ Finalize” button.
Report
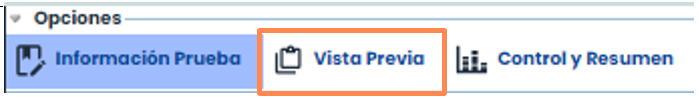
To view and download the report, switch to the “Preview” tab at the top.
In this option, you can view the information included in the recovery plan itself. It is possible to review all the text or planned sections, and it can also be downloaded as a report.
Only the recovery plans that have been selected will appear.

To view the information, enter it, and the information previously parameterized in the plan itself will appear.
Control and Summary
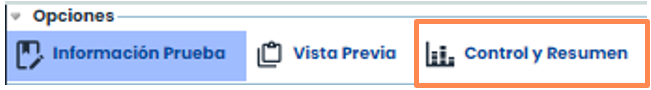
To monitor and review the summary, switch to the “ Control and Summary” tab at the top.
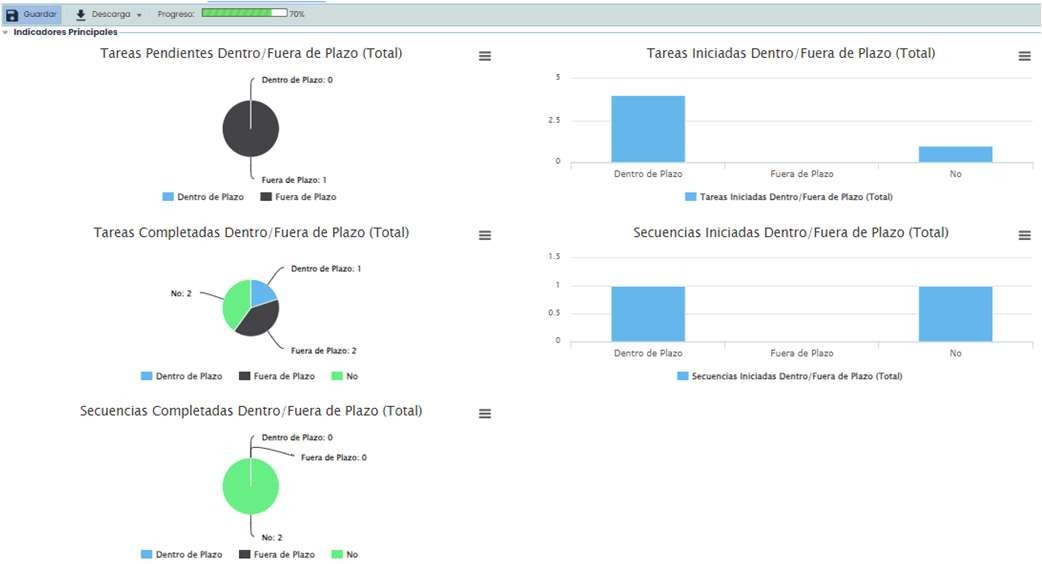
It is a dashboard that allows real-time monitoring of the status of each task. It indicates the progress of the test and which tasks are completed, started, overdue, etc.
Below, general data such as planned start and end dates, delay time, total test duration, etc., are displayed. Within these options, some calculations made by GlobalSuite® can be observed.
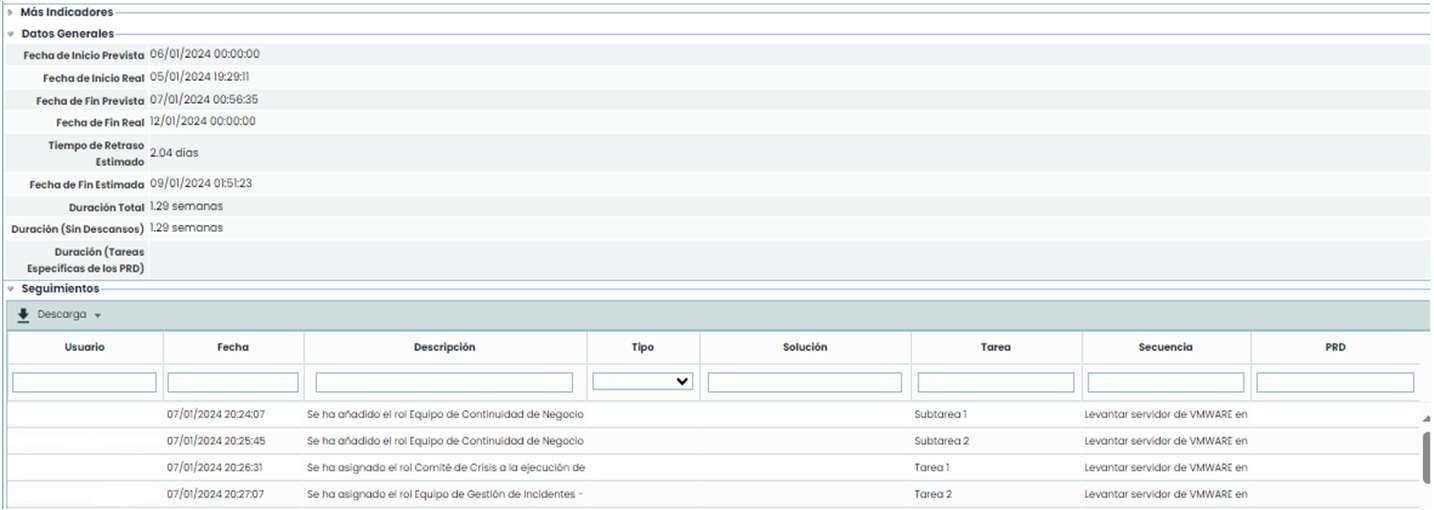
Additionally, there is a table where all the follow-ups/tasks performed during the test are automatically recorded, with the possibility of downloading this information.
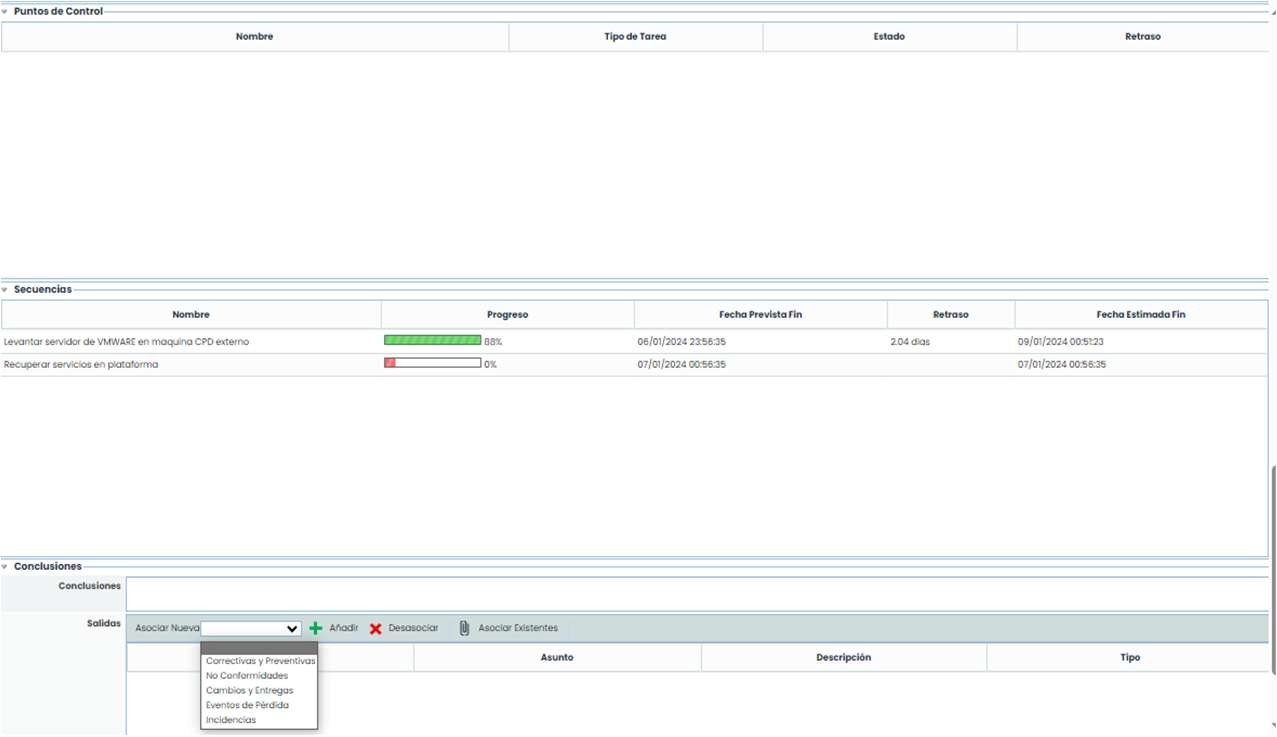
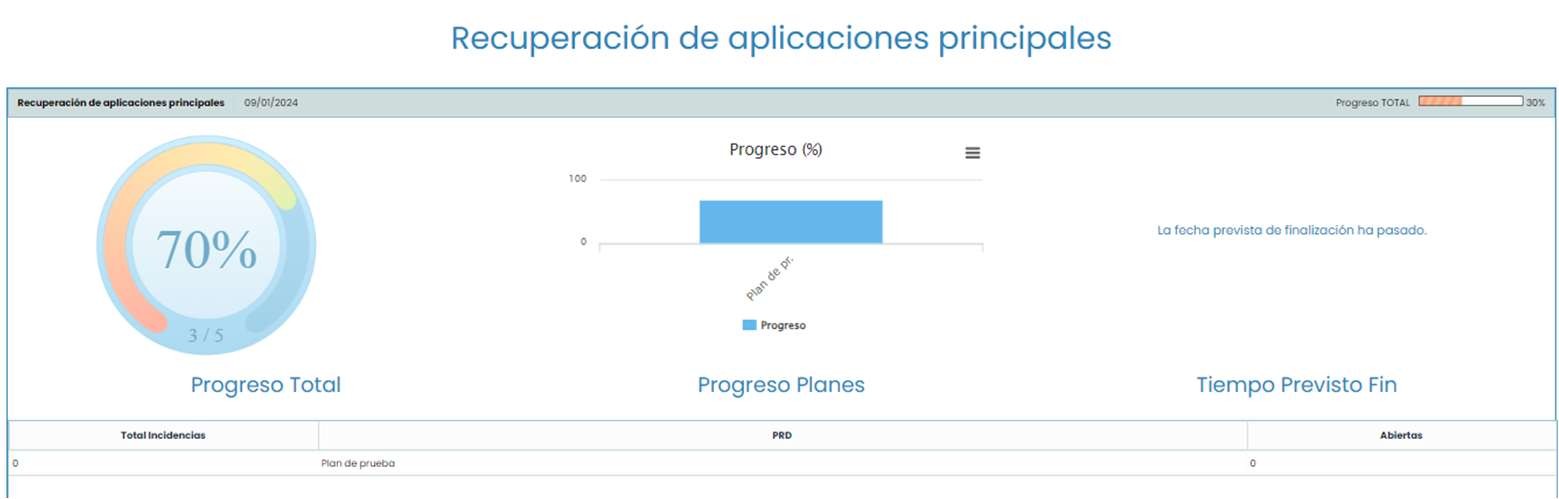
There is also a control panel that, in addition to marking the RTO time, provides access to an alternative screen by clicking the “ Control Panel” button. This screen shows the test progress, a graph with sequence progress, and a countdown. It serves to visually track progress.
If any task has control points, they will appear in this option. The sequences with their progress and dates also appear. At the end, conclusions or the relationship of each task with a series of incidents, changes, corrective actions, if any occurred, are displayed.