This tutorial explains, step by step, how to configure and use the risk grouping in GlobalSuite®, also referred to as risk types or risk taxonomy.
This guide details how to create and link risk categories within the analysis catalog, how to perform automatic and manual risk categorization in analyses, and how to obtain segmented reports based on the configured typologies.
Additionally, it explains how to associate risk catalogs with analyses, leverage hierarchical categorization, and view results from the Risk Map and the Risk List to facilitate evaluation and decision-making.
Introduction
GlobalSuite® allows conducting risk analysis by categorizing them by risk typology, in order to obtain segmented information based on this discretization.
It is worth mentioning that in GlobalSuite® this functionality appears under different names, such as: “Risk Grouping,” “Risk Types,” and “Risk Taxonomy,” all referring to the same option.
It is also worth highlighting that risk categorization can be performed hierarchically, with the required structure and levels. For example:
Configuration. Grouping and linking with the catalog.
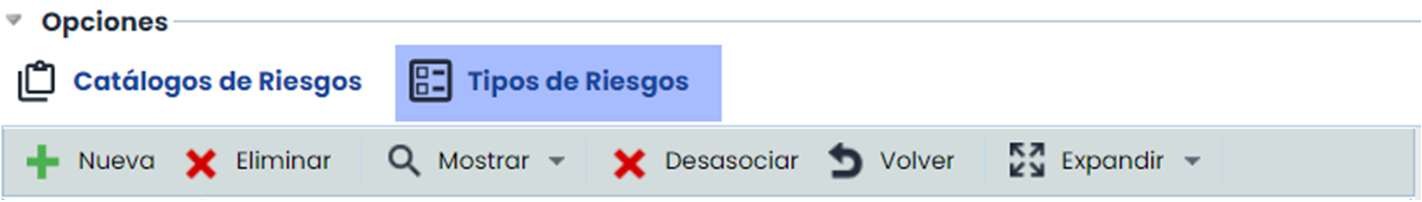
The configuration of this functionality is available from Settings > Templates > Analysis Catalogs , specifically in the “Risk Types” tab, as shown in the example in the following image:
To use categorization, it is required to create risk categories and associate them with the risk catalog to be used in the analysis.
From this option, it is also possible to group risks by category. In this way, when risks are automatically proposed from a catalog in the analysis, GlobalSuite® will categorize these risks according to this configuration. It is worth mentioning that risks can also be manually categorized within the analysis itself, with the only requirement being that the catalog used has these categories associated in this option.
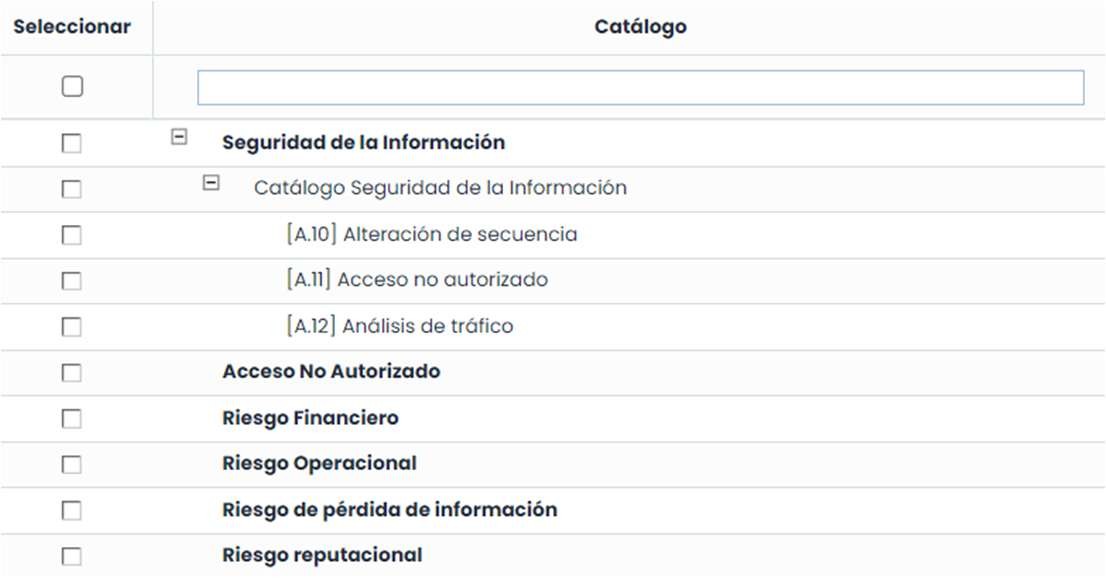
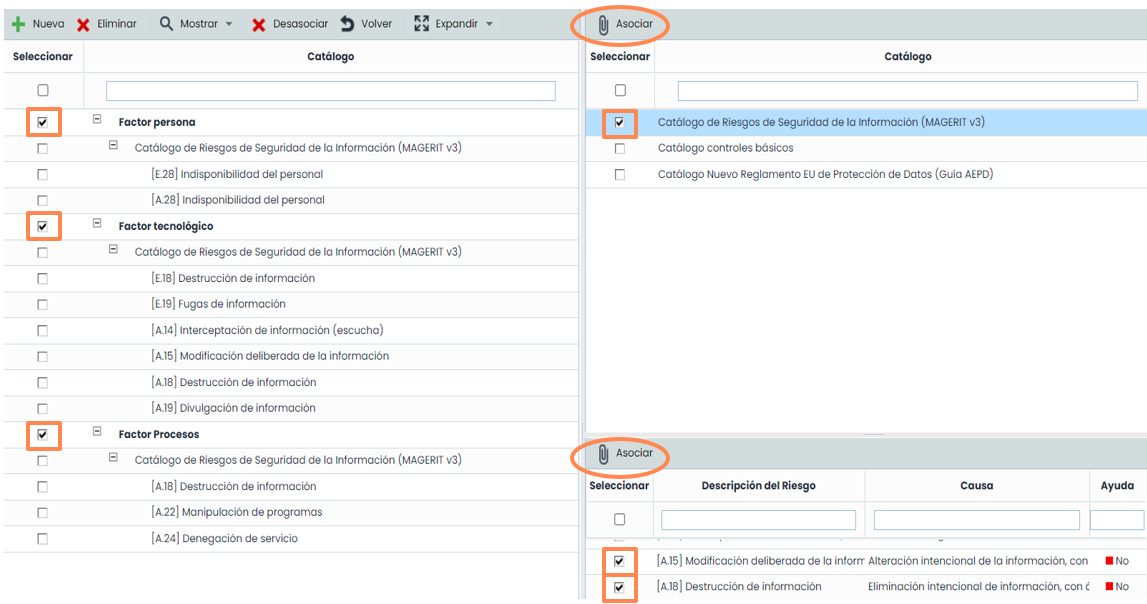
The association with the catalog is done by marking the categories on the left side of the screen and the catalog(s) on the right side. After that, simply click the “Associate” button. Risks can also be categorized. By selecting the catalog, the risks are displayed in the lower table, and you can select the category and risks; this time clicking the “Associate” button in the risk table, and they will be categorized.
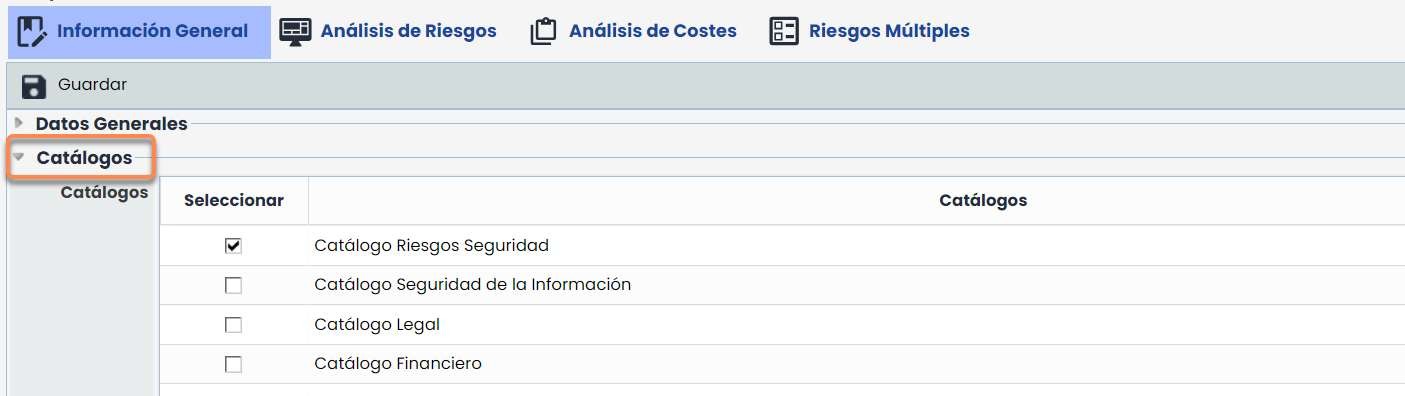
As a reminder, the association of catalogs to a Risk Analysis is done from the risk analysis itself, specifically in the “General Information” tab. In the “Catalogs” section, the list of available catalogs that can be used for risk analysis appears. It is mandatory to use a specific catalog, at least for informational purposes, as this allows the tool to associate a set of risks and vulnerabilities to each element, based on its defined category.
To select a catalog, simply click on the “check” that appears next to each one.
Automatic risk categorization
It is possible to perform automatic categorization of risks in an analysis by leveraging the existing automatic risk association functionalities within the analysis itself.
As a reminder, within risk analysis, among others, there are two different ways to assign risks from the associated catalogs. In both, automatic categorization can be utilized.
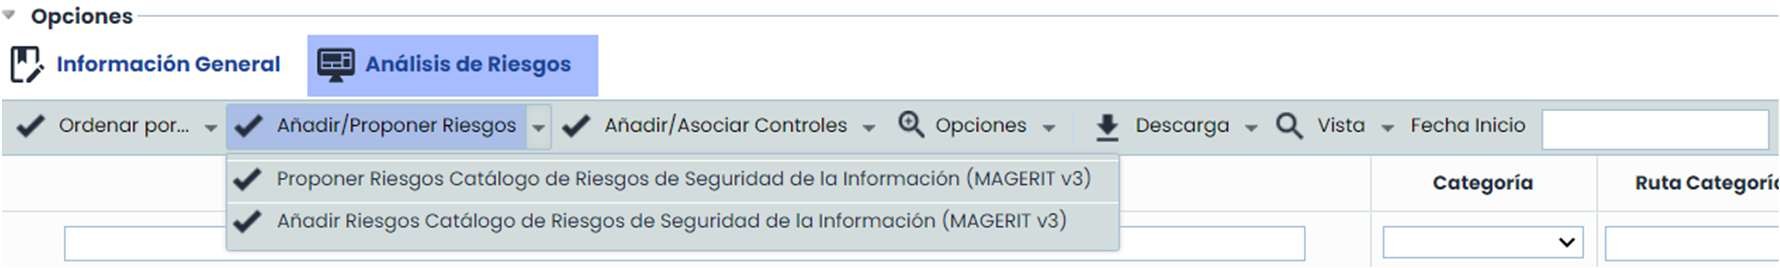
Whether using the functionality “Propose or Add Catalog Risks”…
… or using the functionality “Retrieve Risks”…
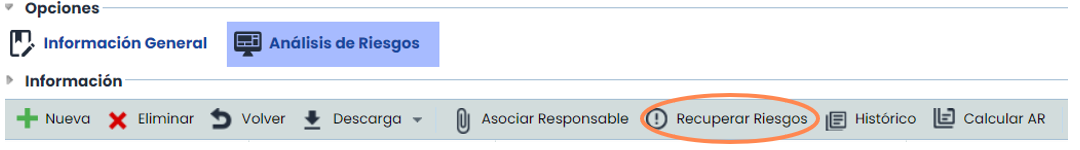
..., they will be automatically categorized respecting the configuration made in the previous section.
Manual risk categorization.
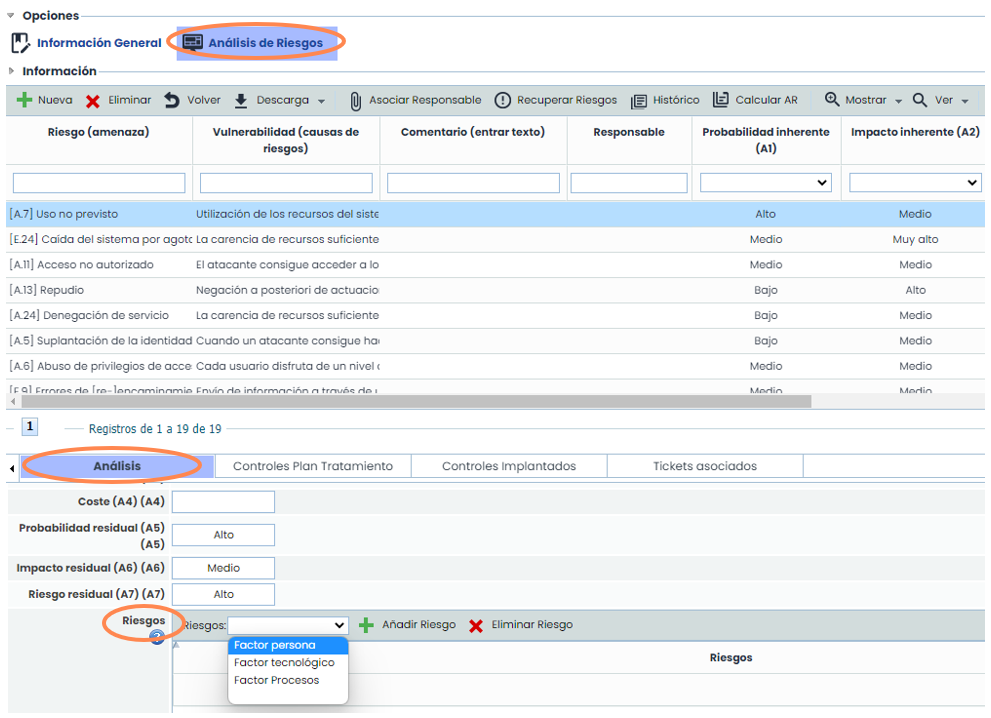
Within a Risk Analysis , selecting one of the risks displays all the related information in “form” format at the bottom of the screen.
In the first tab, “ Analysis,” there is the field “ Risks,” which provides information about the categories associated with it and also allows manual categorization.
Discretization and Evaluation.
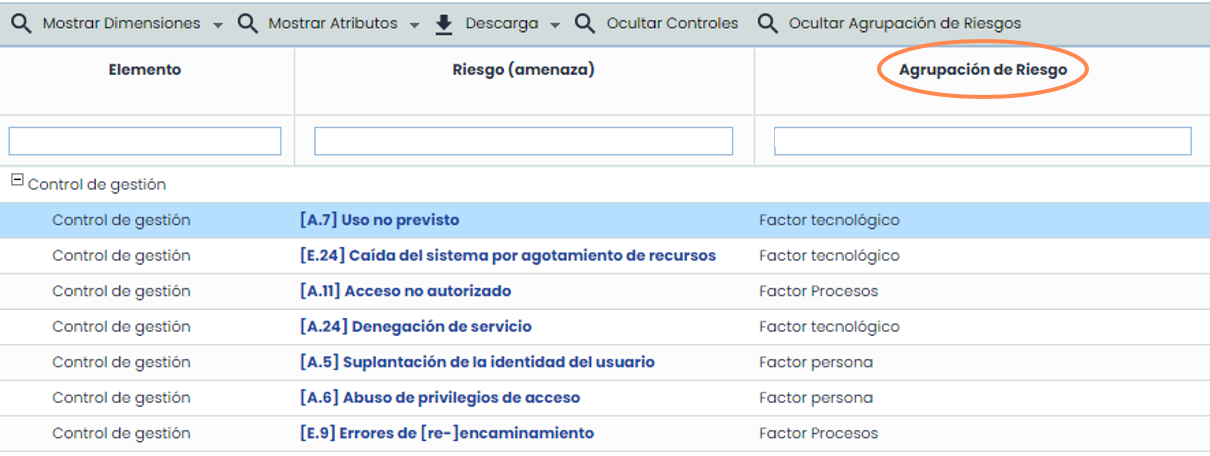
From the Risk Evaluation option, result reports can be obtained based on the configured categorization. The “View Risk Map” tab allows creating reports filtering risks by levels, also providing a large amount of related information and attributes; one of them being the field “ Risk Grouping,” as shown in the following image:
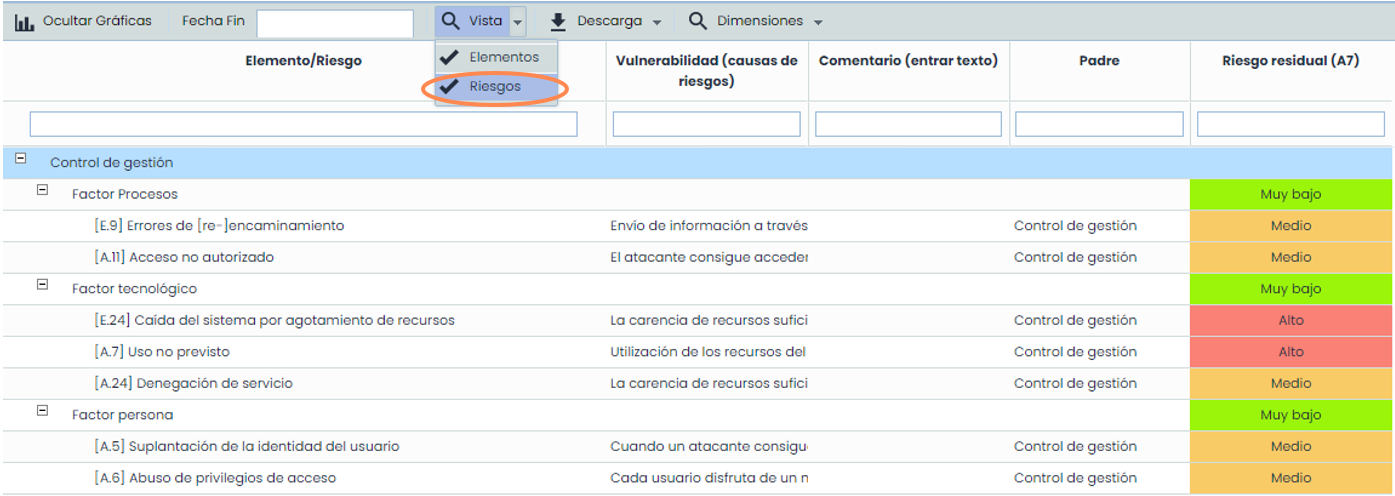
From the “View Risk List” tab, risks from the analysis can be consulted both in table form and graphically, by category or by element against the NRA and NRO values of the analysis. In the following image, the mentioned graph is shown where the filter has been applied based on the categories:
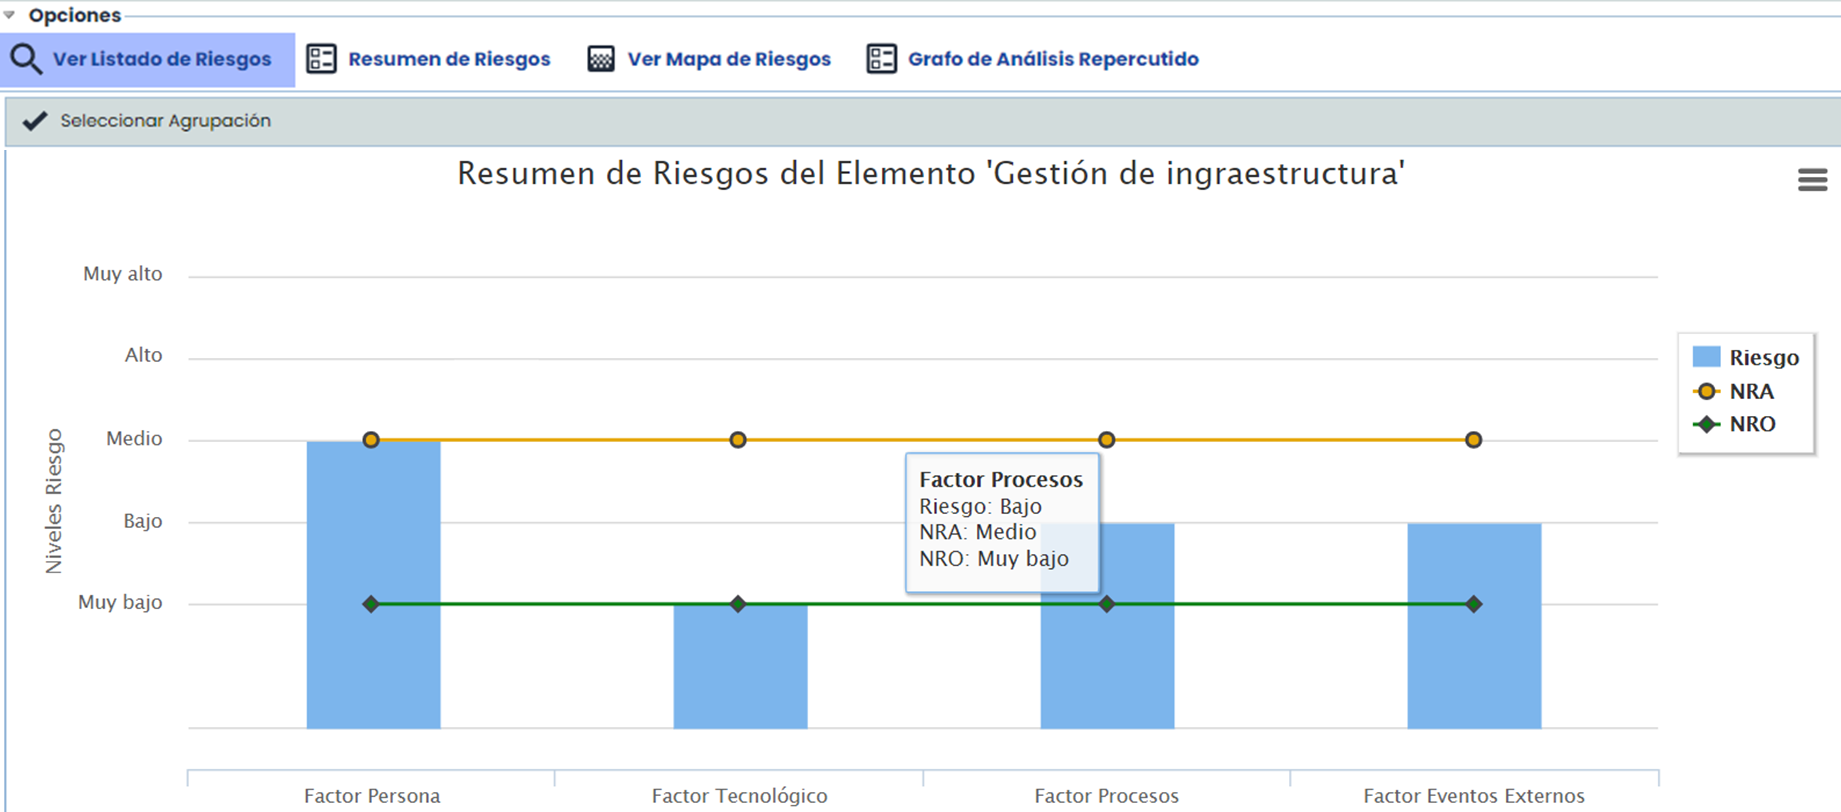
The categories shown in the graph can be filtered using the “ Select Grouping” button that appears in the upper left corner.
Both the graph from the previous image and the table shown below with the segmentation of risks by category are obtained by selecting the “View” button and the “Risks” option, as shown below.