This tutorial explains, step by step, how to visualize, analyze, and report the results of risk analyses in GlobalSuite® through the Risk Assessment options.
This guide details how to access the module to select the desired analysis and use the different available views: the Risk Map, the Risk List, and the Risk Summary.
It also shows how to generate heat maps, comparative charts, and detailed lists by elements, dimensions, or categories, as well as download reports in Excel or PDF format. Additionally, it explains how to interpret the indicators of the Acceptable Risk Level (ARL) and the Global Risk by Element (GRE) to obtain a comprehensive view of the risk status in the organization.
Risk Assessment
To access the Risk Assessment, you need to click on the option Analysis> Risk Assessment ”. Upon accessing, you must select the risk analysis you want to visualize.

Once selected, three tabs are displayed in a top menu, allowing you to view the results of the risk analysis in different formats. By default, GlobalSuite® displays the “ View Risk Map” tab.
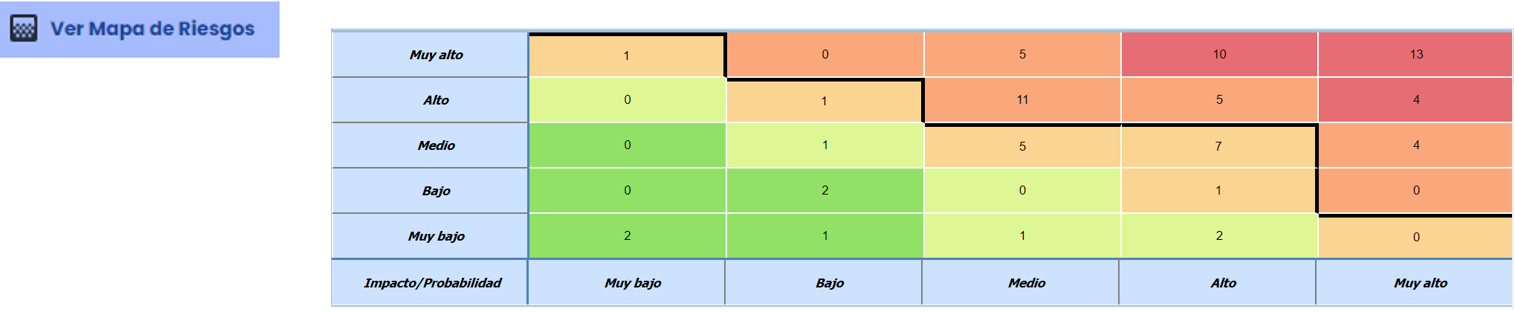
This option displays the risk map (or heat map) with the risks identified in the “ Risk Analysis ” option.

Risk Map
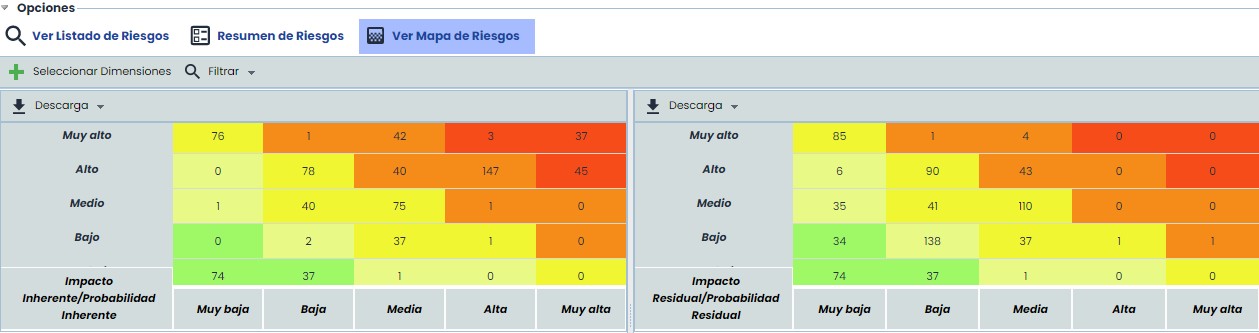
The “Risk Map” is composed of two parts: the risk map itself at the top and the risk table at the bottom. This option shows the “Risks” represented by the two dimensions that calculate the “Risk” (to view this option as explained, it is necessary for the “Risk” to be defined by two dimensions).
At the top of the Risk Map, there are several options that allow configuring the information to be displayed on the Risk Map:
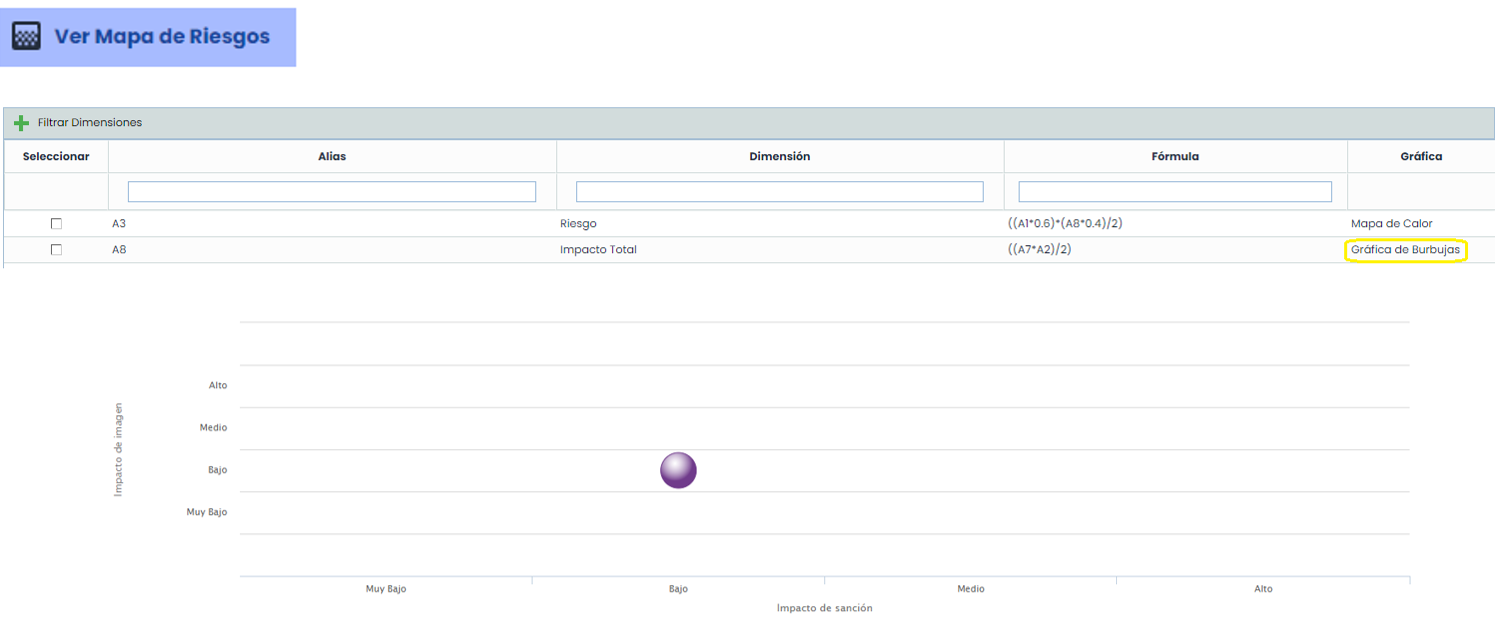
Select Dimensions: Allows you to select multiple automatic dimensions defined based on two other dimensions, enabling multiple heat maps simultaneously. Additionally, it allows you to choose whether any of the charts should be represented as a Heat Map or as a Bubble Chart.
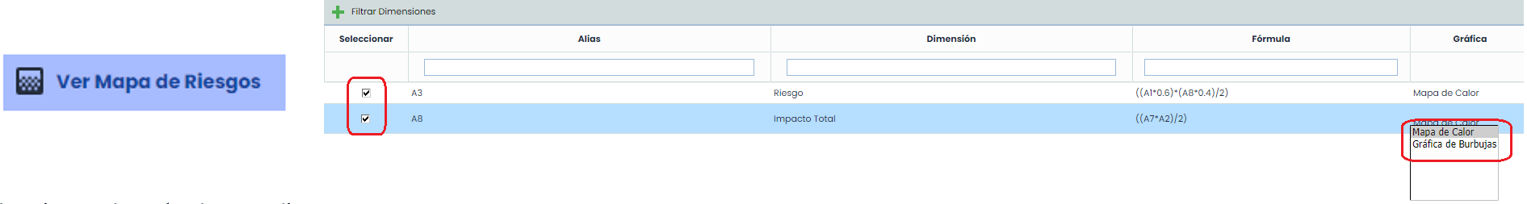
By selecting more than one dimension and clicking the “Filter Dimensions” button, it is possible to visualize multiple heat maps/bubble charts simultaneously:
The previous charts (heat map and bubble chart) are only selectable when dealing with qualitative dimensions; if the dimension is quantitative, then a scatter plot is displayed:
-
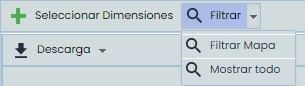
Filter: this option allows you to Show All (executed by default upon entering the option) or Filter Map, where you can select the elements that will be part of the Risk Map. This way, a Risk Map is obtained with only the risks associated with the selected elements.
-
Download: allows downloading the heat map in both Excel and PDF formats.
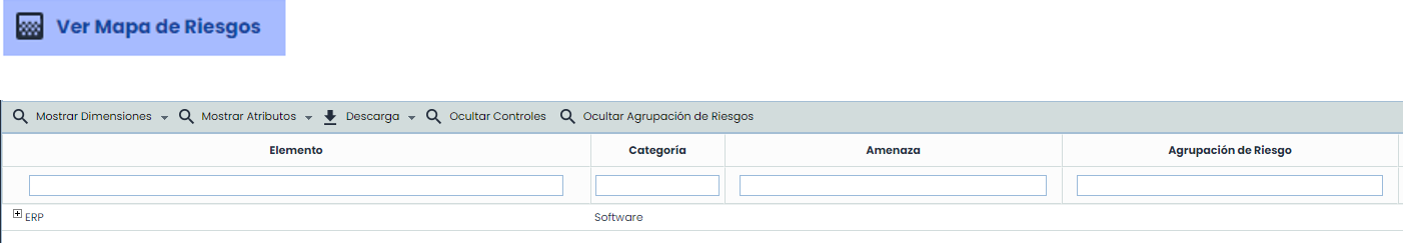
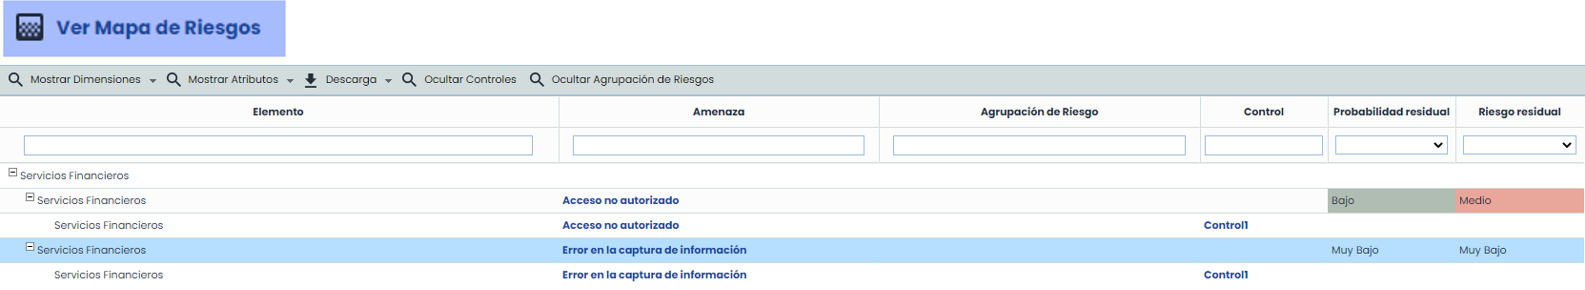
By clicking on a cell in the “ Risk Map”, the risks belonging to the selected section will load at the bottom. For example, if you click on the cell corresponding to “Low” Impact and “Low” Probability, the following “Risks” will load:
In the top bar, the following options are available:
-
Show dimensions (Elements/Risks/Controls): Allows selecting which dimensions (quantitative or qualitative) will appear in the list.
-
Show Attributes (Elements/Risks/Controls): Allows selecting which textual dimensions (attributes) will appear in the list.
-
Download: allows downloading the table in Excel format and the Risk report.
-
Hide controls: hides the “Control” column from the table.
View Risk List
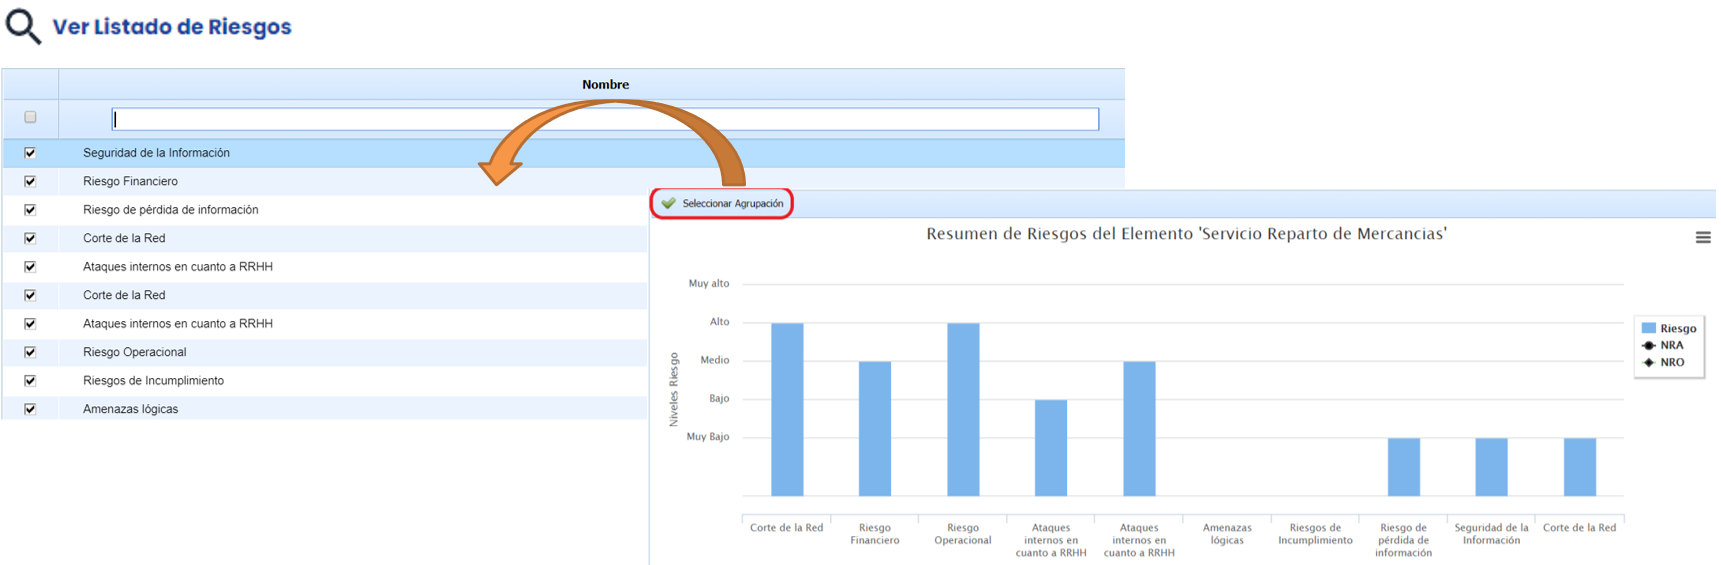
In the first tab of “ Risk Assessment”, “View Risk List” displays two charts. The first represents the number of risks by risk dimension, and the other represents the number of risks that exceed the “ ARL” and those that do not.
Note: “ARL” stands for Acceptable Risk Level, a value defined for risk analysis.
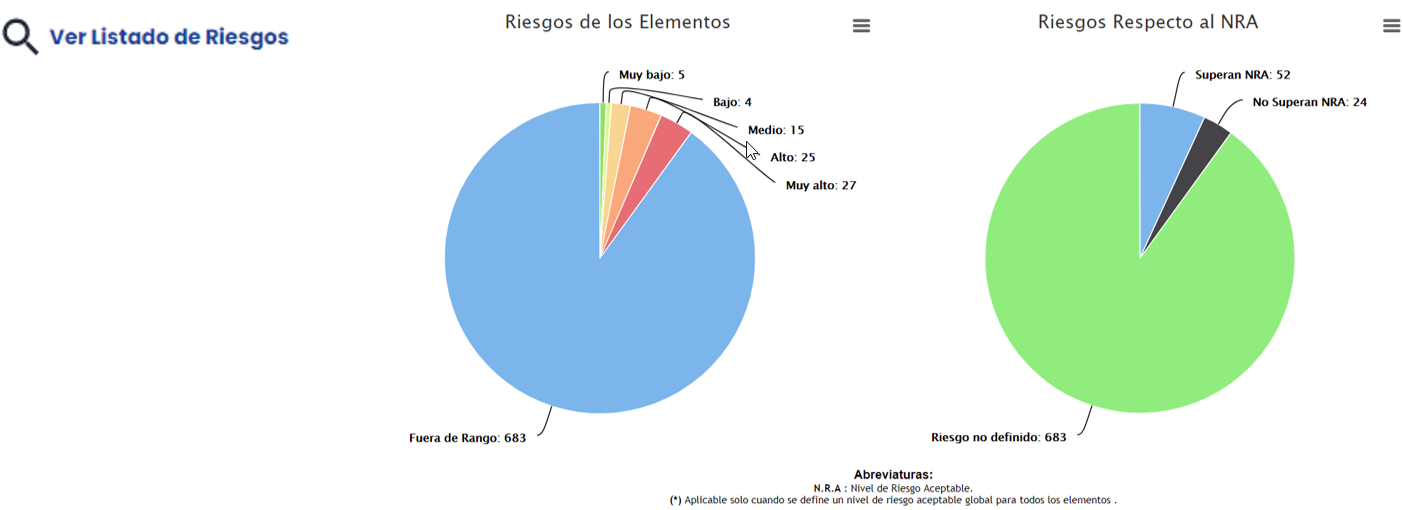
At the bottom, we find the risk list, with the default view of “Elements”, to which belong the name of the “Threat”, “Responsible”, the “Risk Grouping” (if it belongs to any), the “ARL” value of the element, and the “Risk” value of the threat.
Initially, the table will only display the “Risks” that exceed the “ARL”. However, through the top “Show” button, we can display the following:
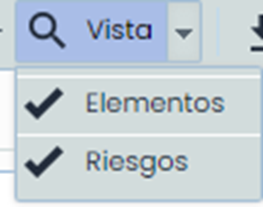
The tool also allows viewing by Risks (“Risk Grouping”) using the “View” button:
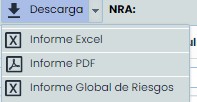
It is also possible to download the report in two formats (Excel and PDF) and the Global Risk report in Excel:
If the view is changed to mark “Risks”, the table content varies, showing the “Risk” value in the columns and the “Parent” information, which is the element to which they belong.
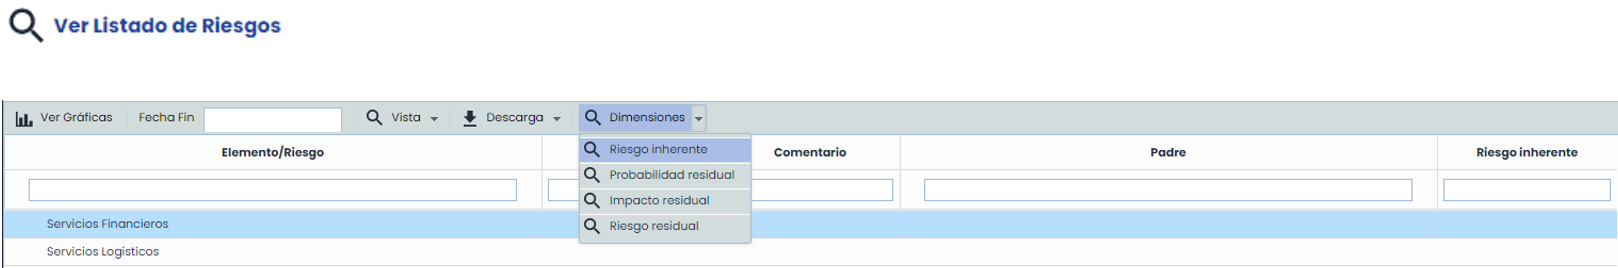
In this view, instead of the “Show” button, the “Dimensions” button appears, allowing filtering the information of the Risk Assessment. The filter is applied to the methodology dimensions.
Once the desired dimension is selected, the chart and table information is updated.
The chart also changes; now, not all risks will appear, as only the top-level ones are displayed. To display more risks, you must select them in the “Select grouping” button, where the entire tree can be viewed.
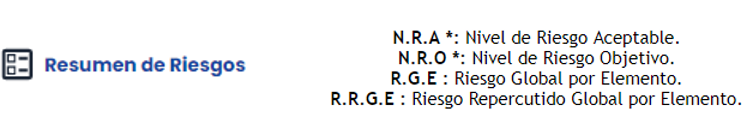
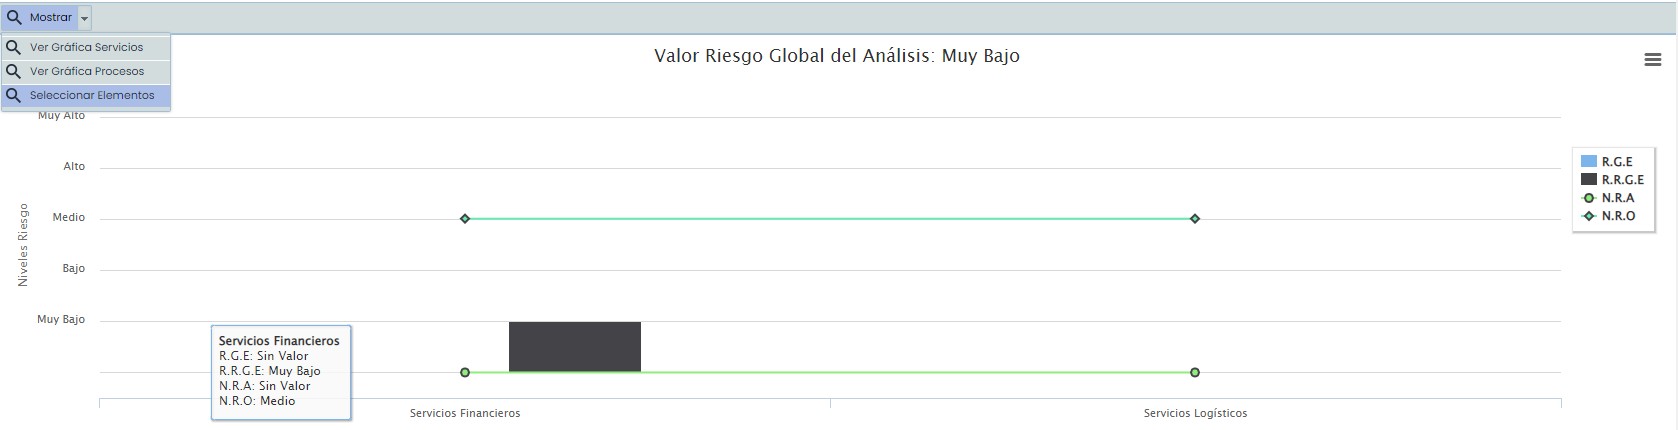
The “Risk Summary” consists of two parts: the upper chart and the lower table. This option shows the results regarding the “Services” and “Processes” involved in the analysis.
The upper chart represents the risk level by service concerning the following terms:
It is possible to display the Service Chart, Process Chart and also Select Elements, as if there are more than 15 services, they must be selected (in the pop-up window, filtering by taxonomy is also possible).
At the bottom, the “Dependency Tree” is displayed with the values of “GRE (Global Risk by Element)” and “GRGE (Global Repercussed Risk by Element)”, as well as whether it is included in the “Analysis”.
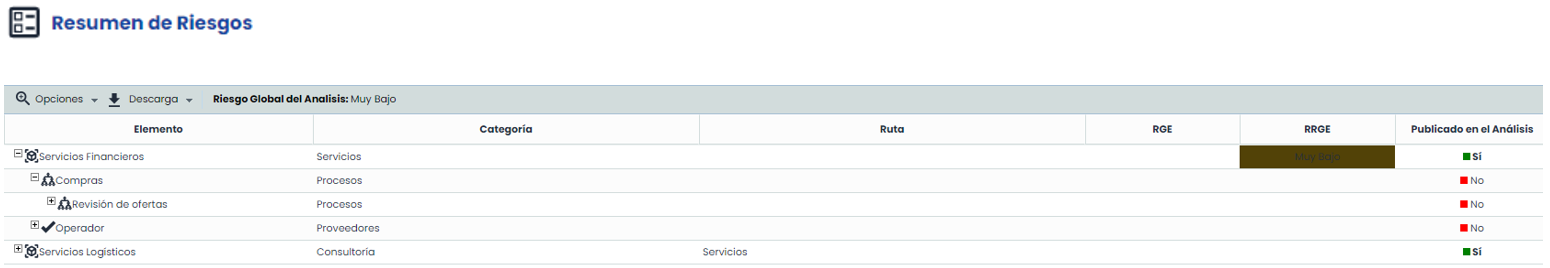
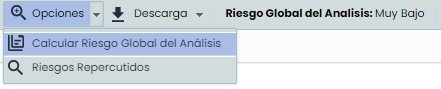
In the top bar under “Options”, we can “Calculate the Global Risk of the Analysis” and view the “Repercussed Risks”, as well as download the information in both Excel and PDF formats.