This guide explains the steps to parameterize a calculation methodology for Residual Risk through the correct implementation of the Controls Methodology .
The first phase related to the company's risk analysis consists of determining the Inherent Risk related to processes, assets, elements… ultimately, the inherent risk of everything that needs to be considered.
The second phase involves applying or understanding the implication of action plans or controls to mitigate the inherent risk, thereby obtaining the so-called Residual Risk.

Risk Methodology. Inherent Risk.
The Inherent Risk, although its calculation methodology depends specifically on each organization, is regularly the result of the interaction between “ Probability” and “ Impact”.
The following image shows an example of a risk analysis in GlobalSuite®:
As a reminder, the configuration of the Risk Methodology is done from the Settings section, specifically from the Methodologies > Risks section.
In the image on the right, you can see the risk methodology behind the risk analysis shown earlier, where the “ Impact” is weighted slightly more.
The Inherent Risk can be obtained through a Formula between Impact and Probability as in the previous example:
Alternatively, among other options, it can be calculated through the configuration of a Cartesian Product:
Controls Methodology and Assessment.
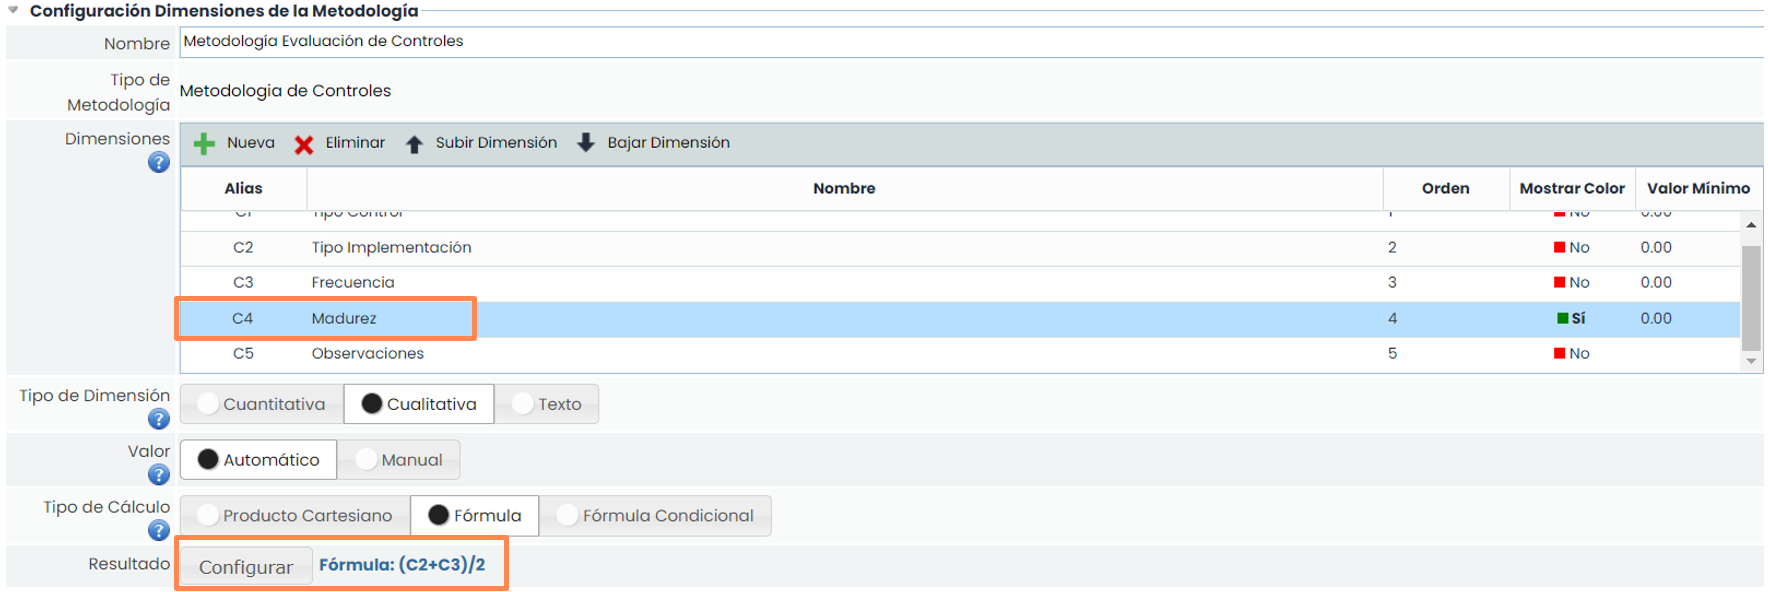
After determining the Inherent Risk, it is necessary to consider the action plans or controls defined to mitigate those risks that exceed the NRA or Risk Appetite. Ultimately, it involves understanding the effectiveness of the applied controls on the Inherent Risk. From Settings > Methodologies > Controls , the dimension related to the Control Effectiveness will be configured. In the example, the Control Maturity is calculated based on other dimensions, properties, and/or conditions specific to the control in question.
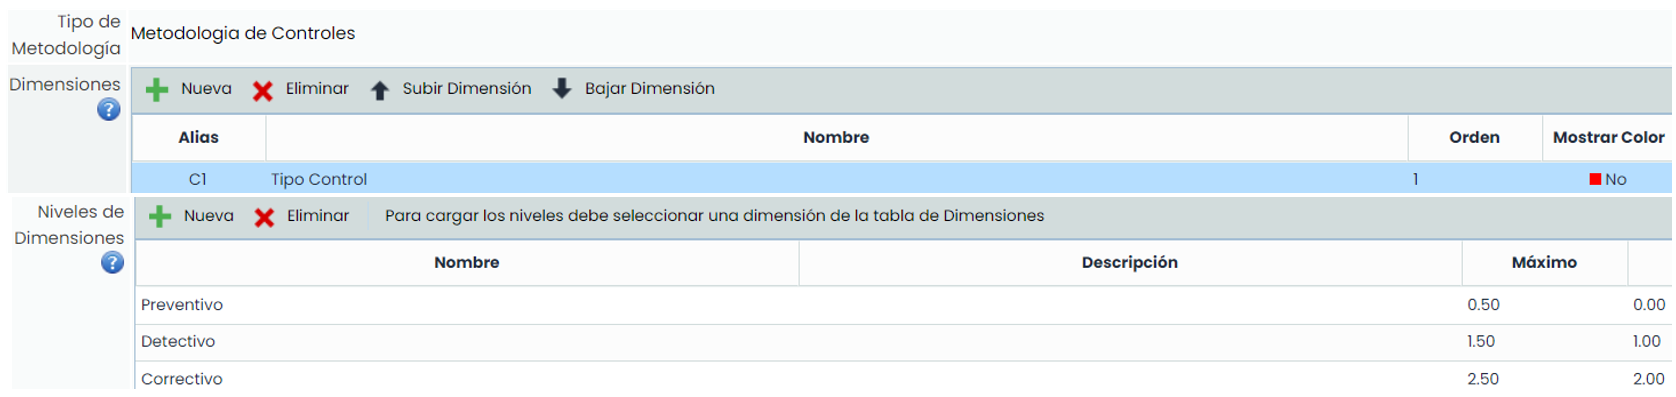
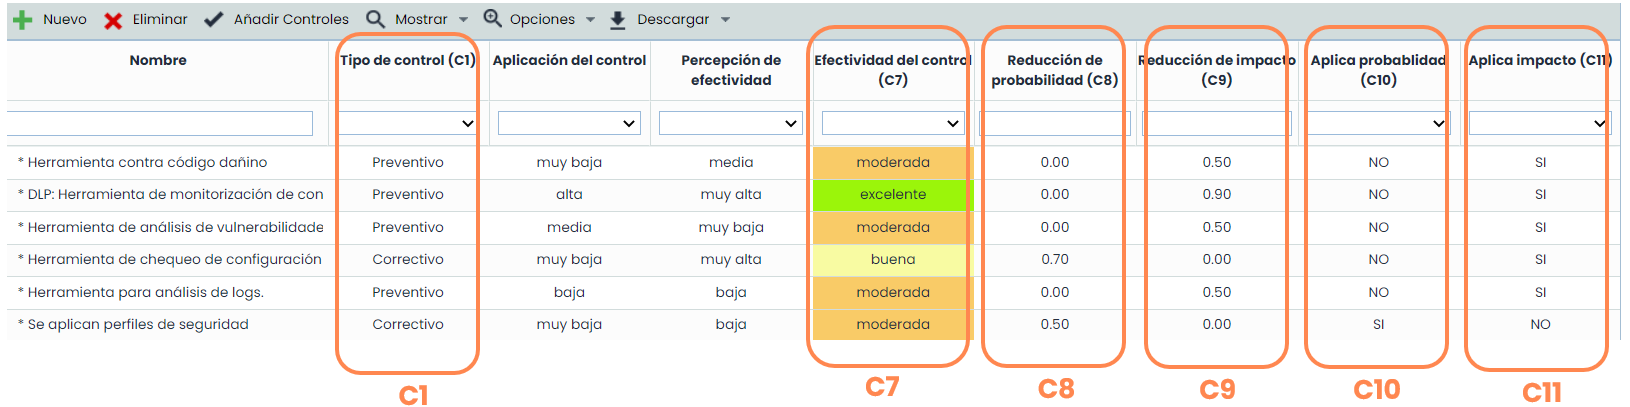
For a more detailed diagnosis of control effectiveness, the nature of the control can be identified, i.e., whether it is “Preventive” or “Corrective”.
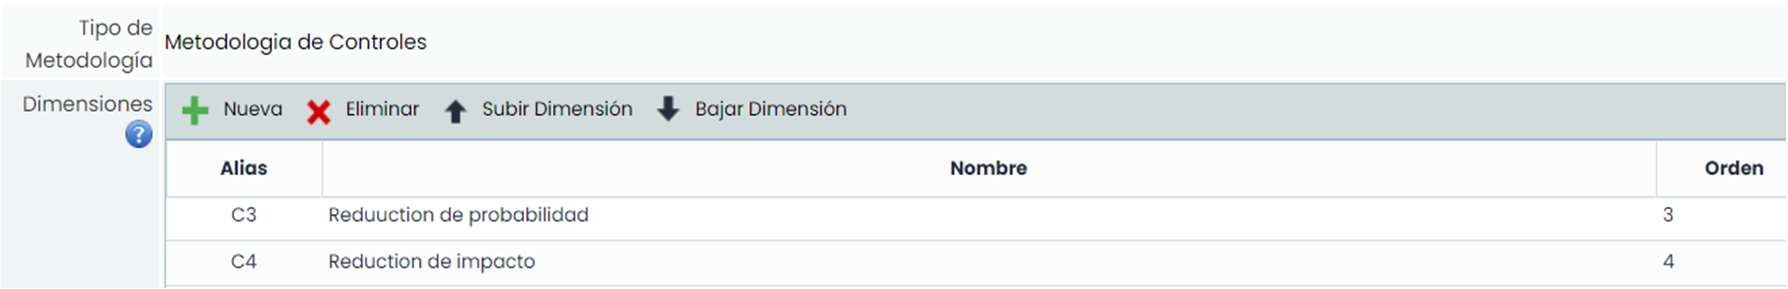
The objective is to determine whether mitigation affects Probability or Impact. For this purpose, the dimensions “ Probability Reduction” and “ Impact Reduction” are generated.
The calculation of the dimensions “Probability Reduction” and “Impact Reduction” is detailed below.
1. For the calculation of the dimension “ Probability Reduction”, the following formula has been used:

Where C1 = “Control Type” and C7 = “Control Effectiveness”.
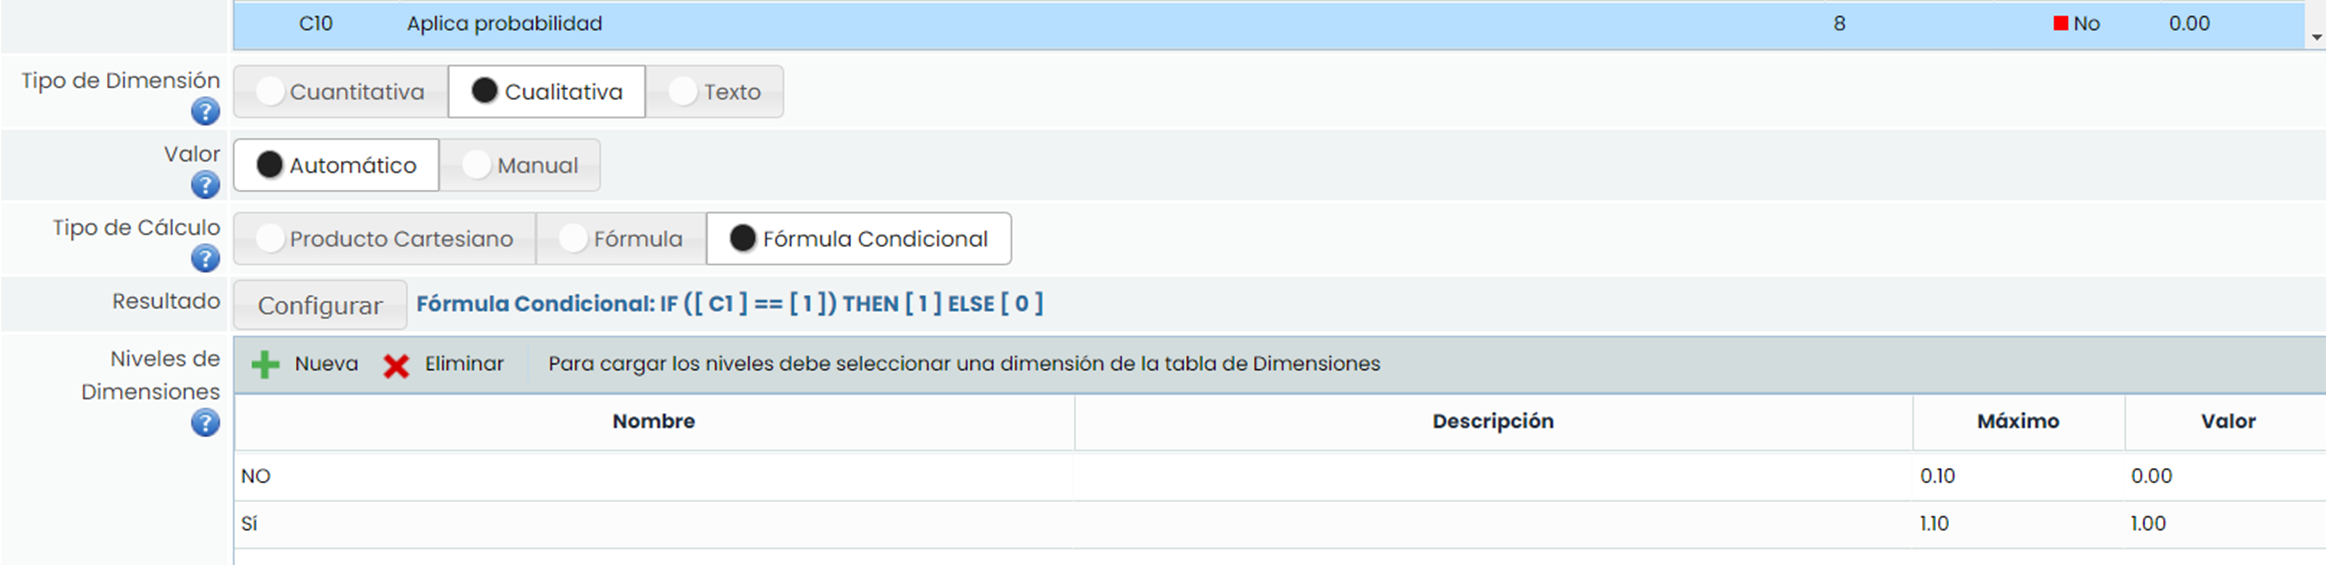
With this formulation, the effectiveness of the control is stored in the “Probability Reduction” dimension, provided it is preventive in nature; hence, this characteristic is verified in the formula condition, C1 = 1.
-
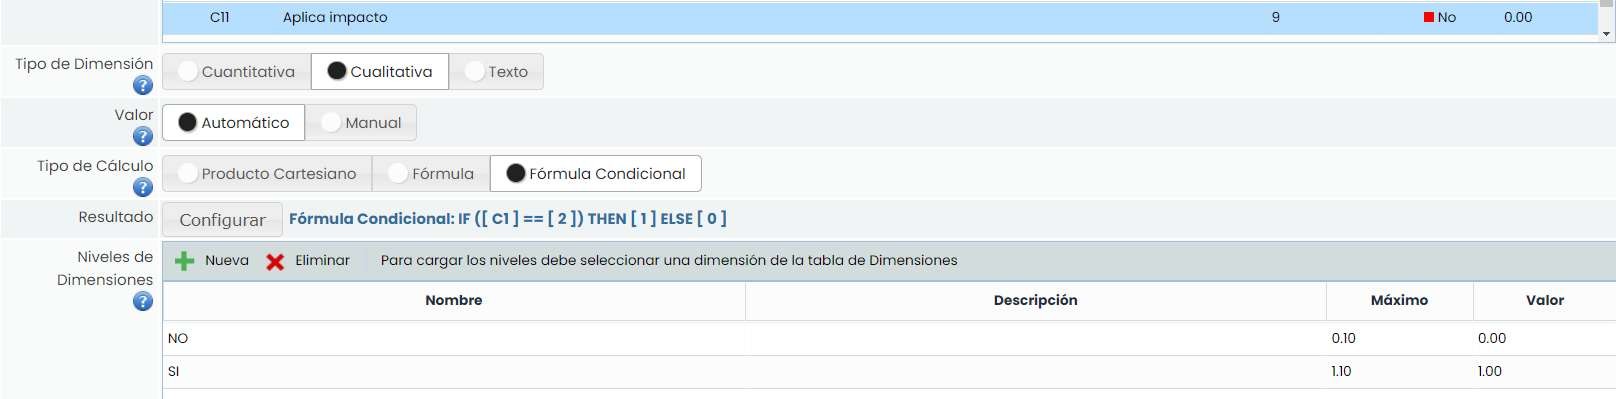
For the calculation of the dimension “Impact Reduction”, the following formula has been used:

Where C1 = “Control Type” and C7 = “Control Effectiveness”.
In this case, the value of the control's effectiveness is stored in the “Impact Reduction” dimension, provided it is corrective in nature, C1 = 2.
This allows the effectiveness of the control to be separated into two different dimensions based on its type.
Simultaneously, a counter will be recorded, separating the controls into preventive and corrective types, with the aim of storing and differentiating the number of controls of each type in two other dimensions.
For this purpose, the dimensions “ Applies Probability” for preventive controls ( C1 = 1)
And similarly, the dimension “ Applies Impact” for corrective controls (C1 = 2):
The next step is to assess the dimensions configured in the controls methodology. To do this, access Controls Management, where manual dimensions can be assessed directly from the screen, thereby obtaining the value of those that are automatic.
Residual Risk.
The final phase, after configuring and applying the Controls Methodology in the analysis, is to configure the Residual Risk dimension, considering the effect of Control Effectiveness on the Inherent Risk. From Settings > Methodologies > Risks , the residual dimensions “Residual Probability,” “Residual Impact,” and “Residual Risk” are generated as shown in the following image:
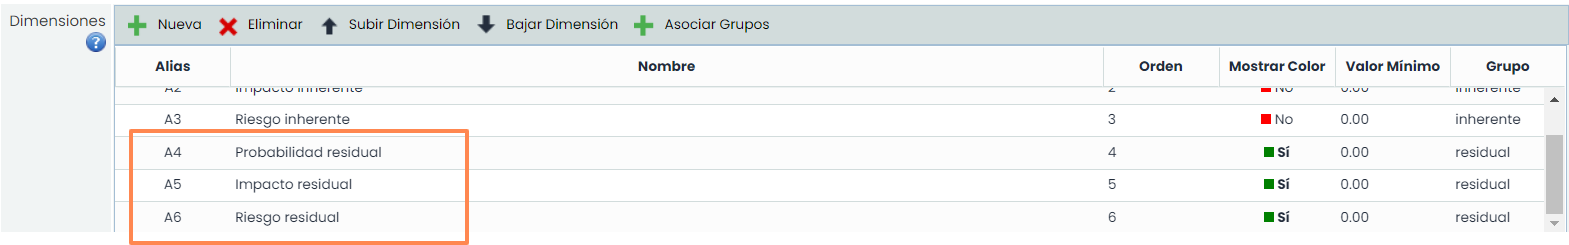
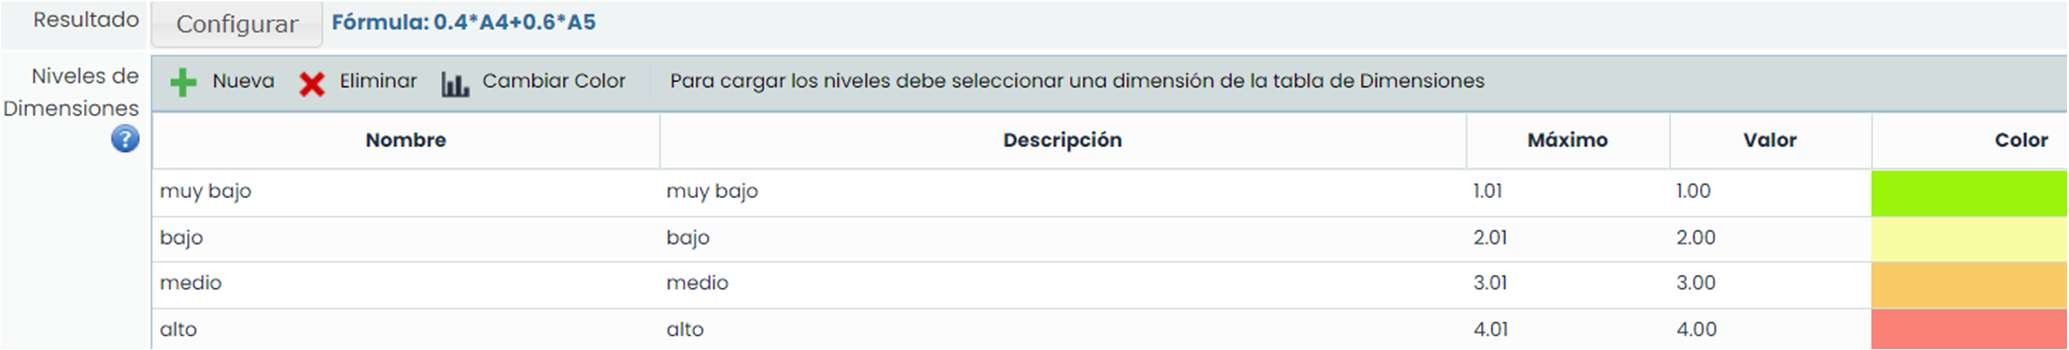
The residual dimensions will have the same design characteristics as their inherent counterparts (qualitative with the same defined levels), with the difference that in this case, their calculation will be automatic through a formulation that relates the inherent dimensions to the effectiveness of the controls.
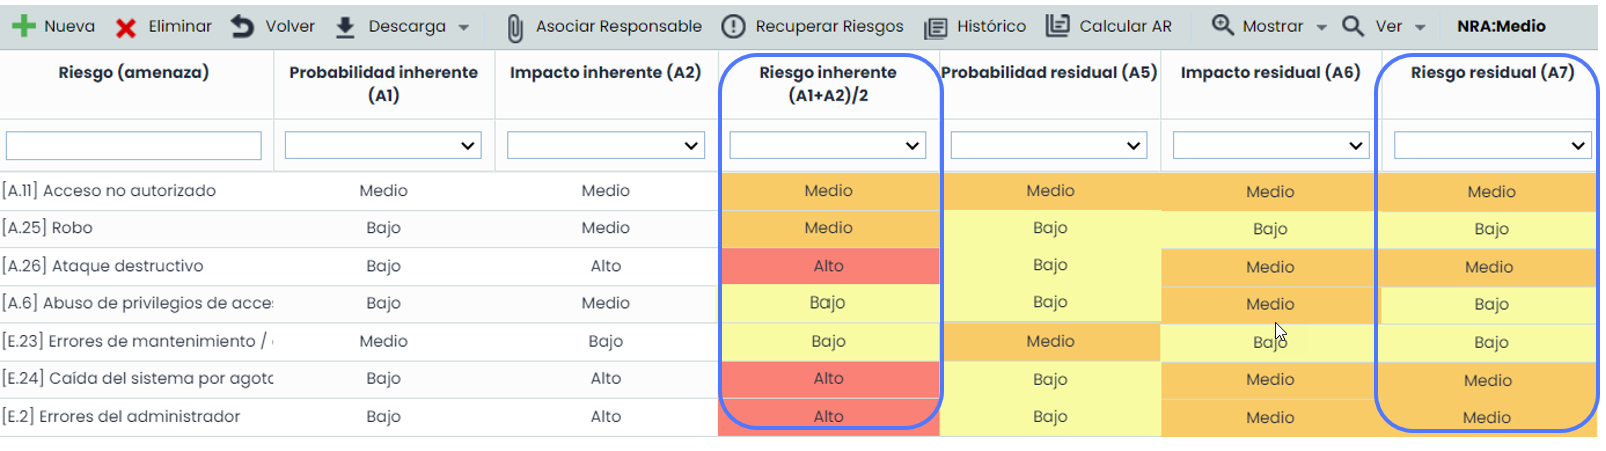
The following image shows the effect of the implemented controls on the inherent probability and inherent impact of the risks; and consequently, on the inherent risk:
In the example: Residual Prob. = Inherent Prob. – Average control effectiveness (Probability).

C8 = Probability Reduction (Effectiveness of controls that mitigate probability).
C10 = Applies Probability (Controls that apply to Probability).
Similarly: Residual Impact = Inherent Impact – Average control effectiveness (Impact).

C9 = Impact Reduction (Effectiveness of controls that mitigate Impact).
C11 = Applies Impact (Controls that apply to Probability).
Finally: Residual Risk = Weighted sum of Residual Probability and Residual Impact.
From the Risk Analysis , the impact of the controls on the Inherent Risk can be verified.
After associating one or more controls with the risks, they can act on the Inherent Risk, and this effect can be observed in the Residual Risk, as shown in the image.
Finally, from Risk Assessment / View Risk Map, in addition to all the information related to the analyses, a visual comparison between the heat maps of Inherent Risk and Residual Risk can be obtained, providing a very clear view of the effectiveness of the implemented controls, as shown in the following image:
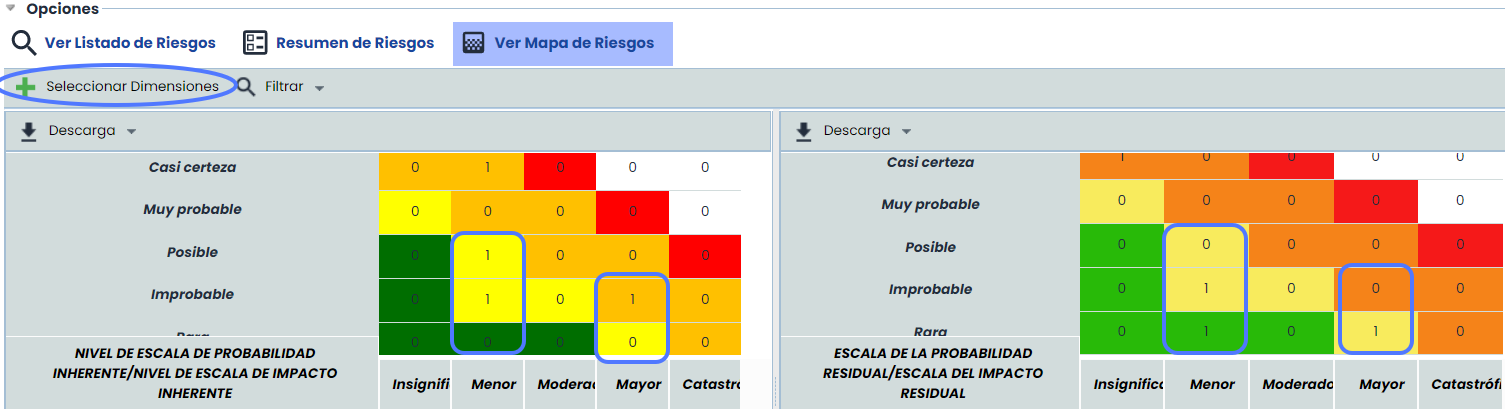
To obtain this comparison, simply click on the “Select Dimensions” button and select the two dimensions to compare, in this case, “Inherent Risk” (Left) and “Residual Risk” (Right).