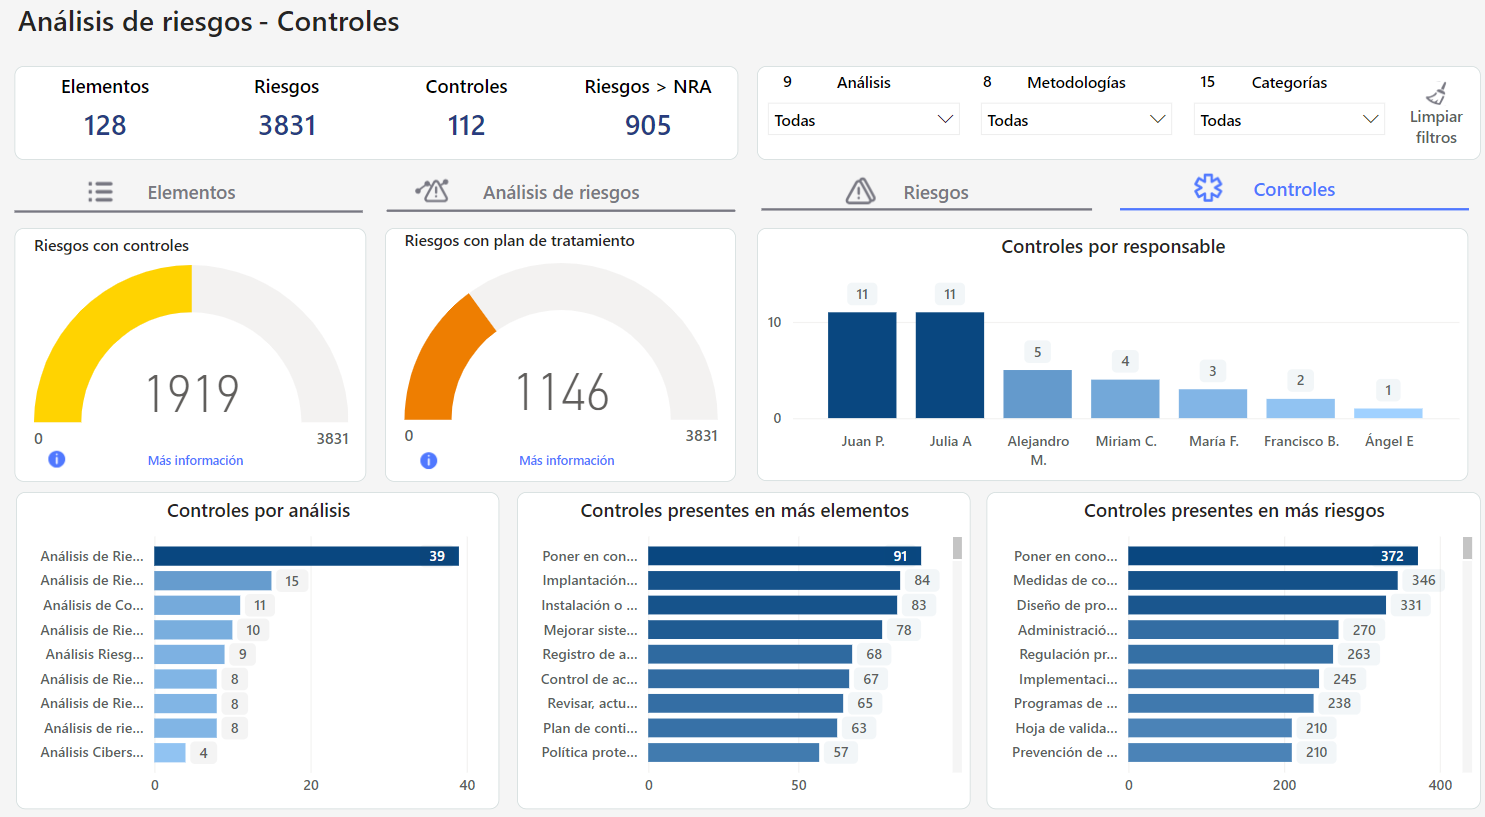
This dashboard facilitates the analysis of risks and associated controls, helping to guide strategic decisions to improve risk management and security.
Main View Controls
Visualizations
Controls present in more elements
It represents how the implemented controls are distributed across the different elements that are part of an analysis and provides information on which controls are more widespread and which may be less represented. Additionally, it includes a tooltip that shows how the elements are distributed by category.
Controls present in more risks
Allows analyzing the relationship between the implemented controls and the identified risks. It can graphically show how many risks are covered by different controls and provide information on which controls are more effective in risk mitigation.
Risks with Controls
Shows the number of risks that are covered by controls. The higher the number, the greater the level of security and control.
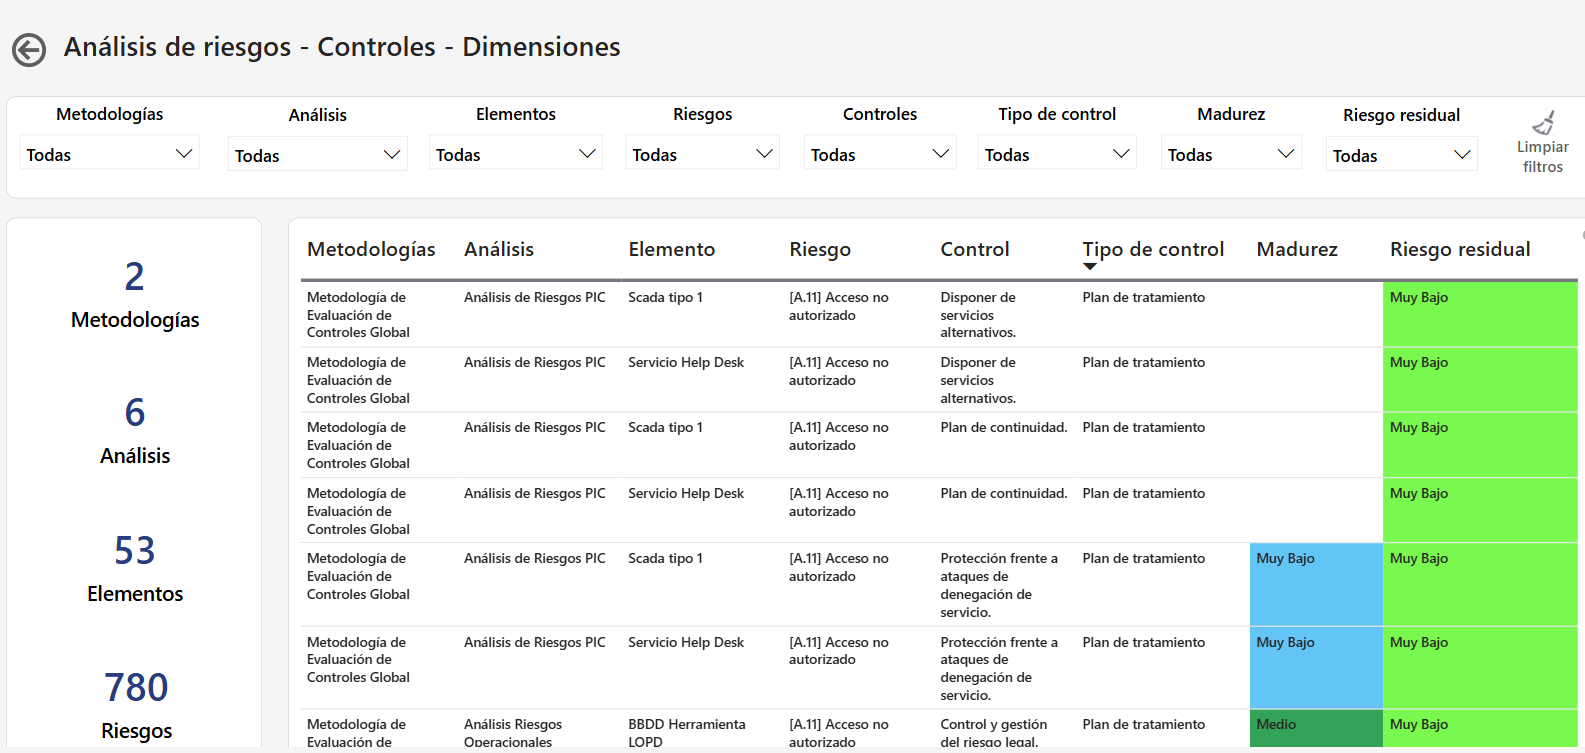
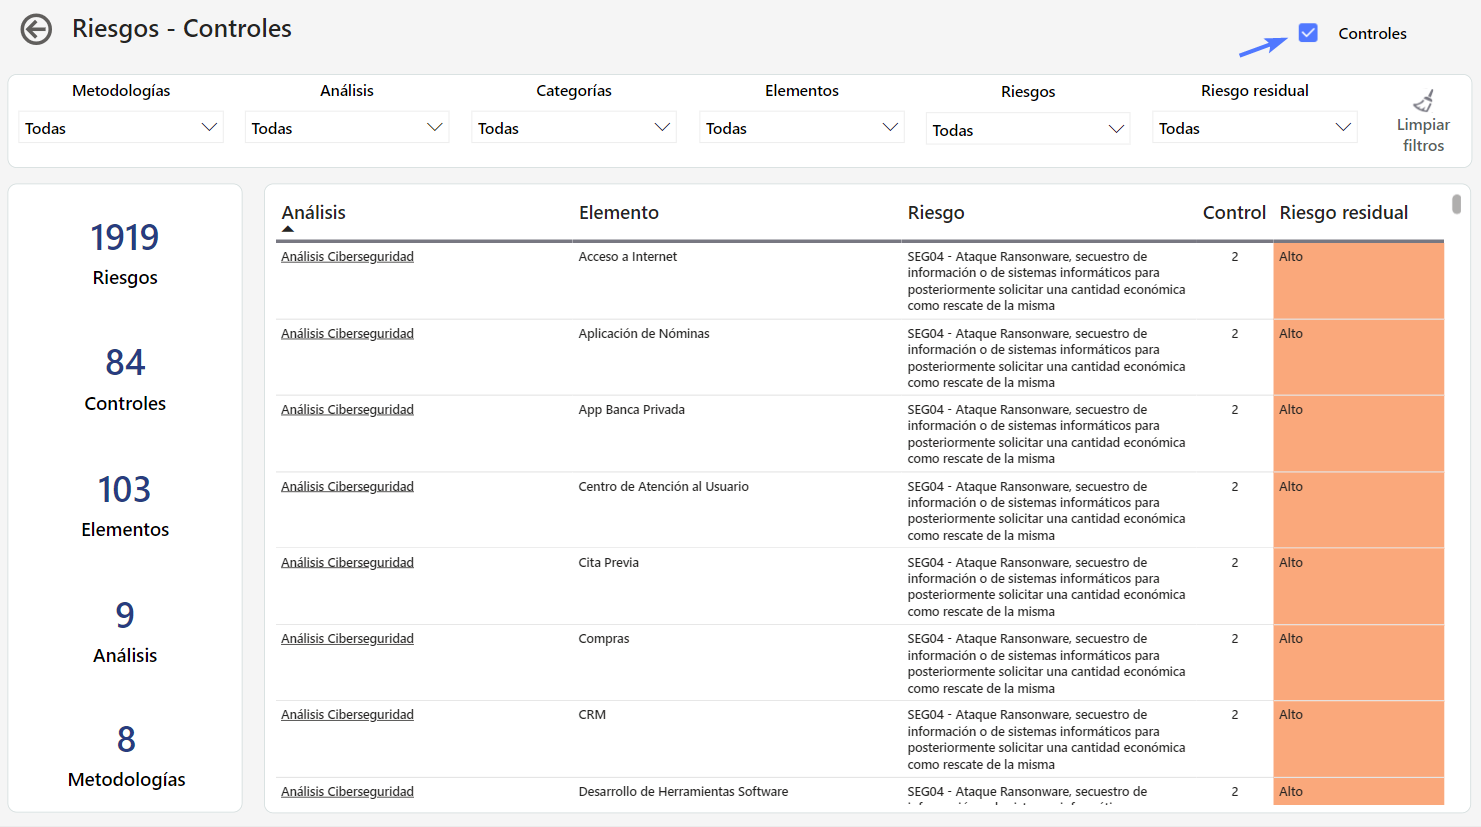
More Information: Risks - Controls
This chart is useful for providing a visual snapshot of the degree of protection against risks and can help guide strategic decisions on resource allocation and the implementation of additional mitigation measures.
-
Check Controls
Allows a detailed visualization of which specific risks are being addressed with controls and which might require more attention in terms of mitigation.
Risks with Treatment Plan
Shows the number of risks that are covered by treatment plans.
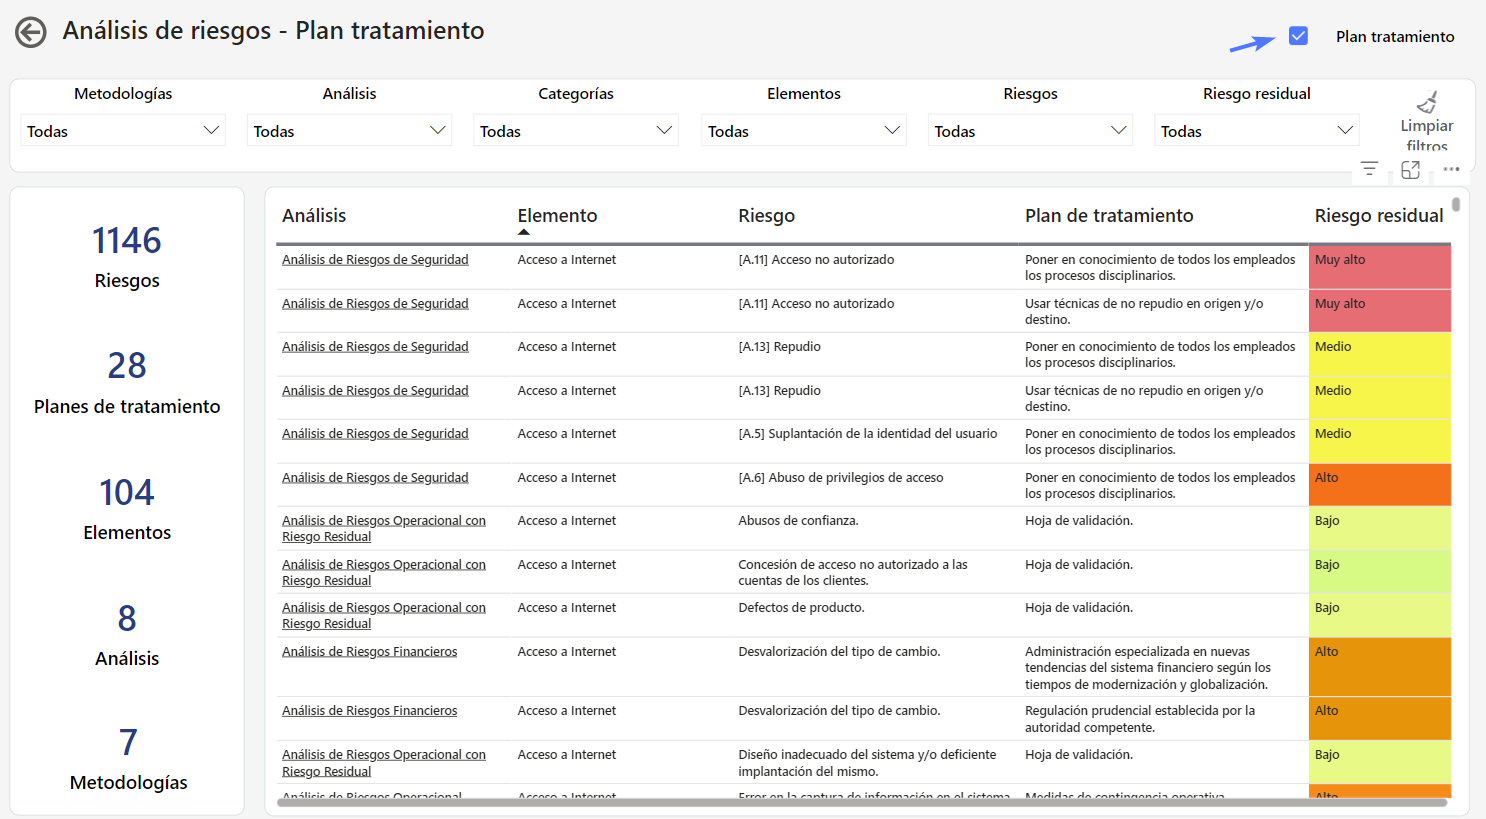
More Information: Risk Analysis - Treatment Plan
This chart provides a quick and clear view of the preparedness status to address identified risks, which can help direct efforts toward developing additional treatment plans and implementing preventive measures.
-
Check Treatment Plan
Allows a detailed visualization of which specific risks are being addressed with treatment plans and which might require more attention in terms of mitigation.
Evidence
This view incorporates charts related to evidence management, aiming to provide a more detailed view of the evidence associated with the controls.
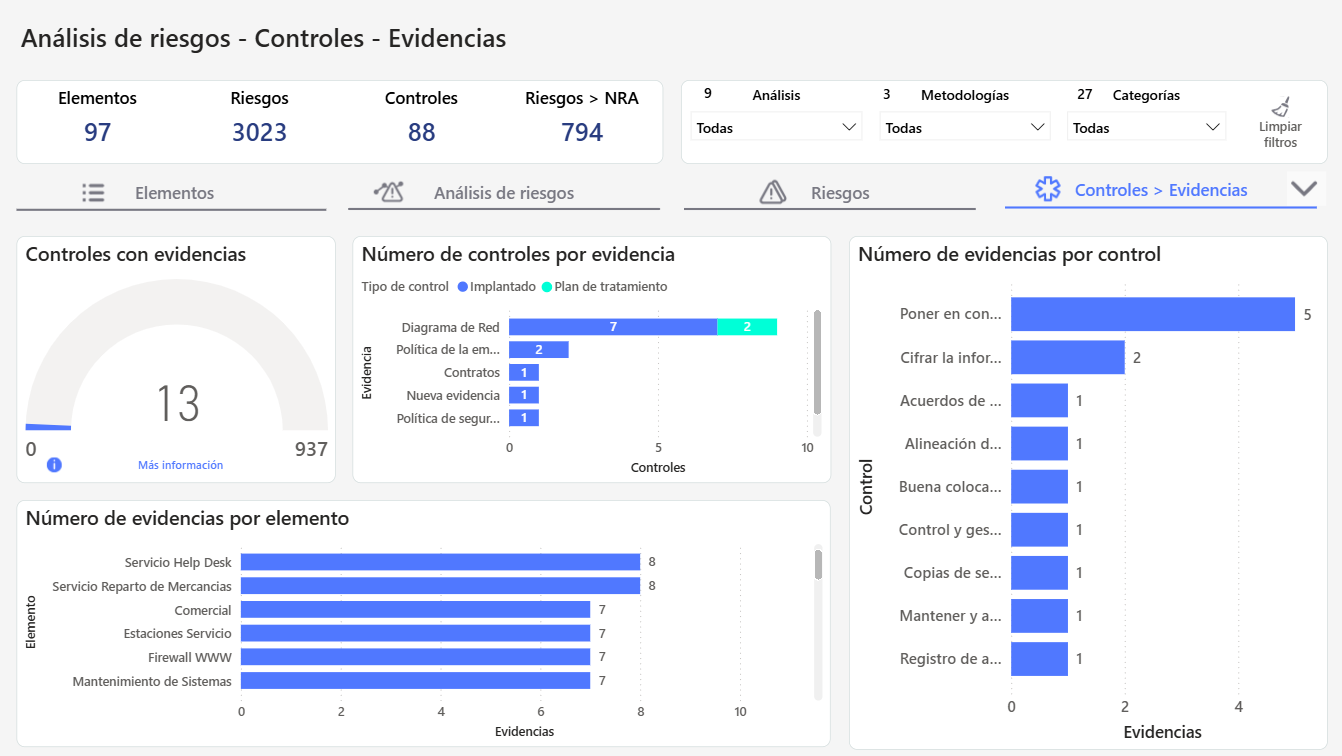
Controls with evidence
This visualization includes the option "More information", which allows access to detailed data in table format.
Dimensions and Assessments
This view includes charts that facilitate the analysis of the effectiveness of controls and their distribution according to configured qualitative dimensions. These visualizations support a deeper evaluation of control performance.
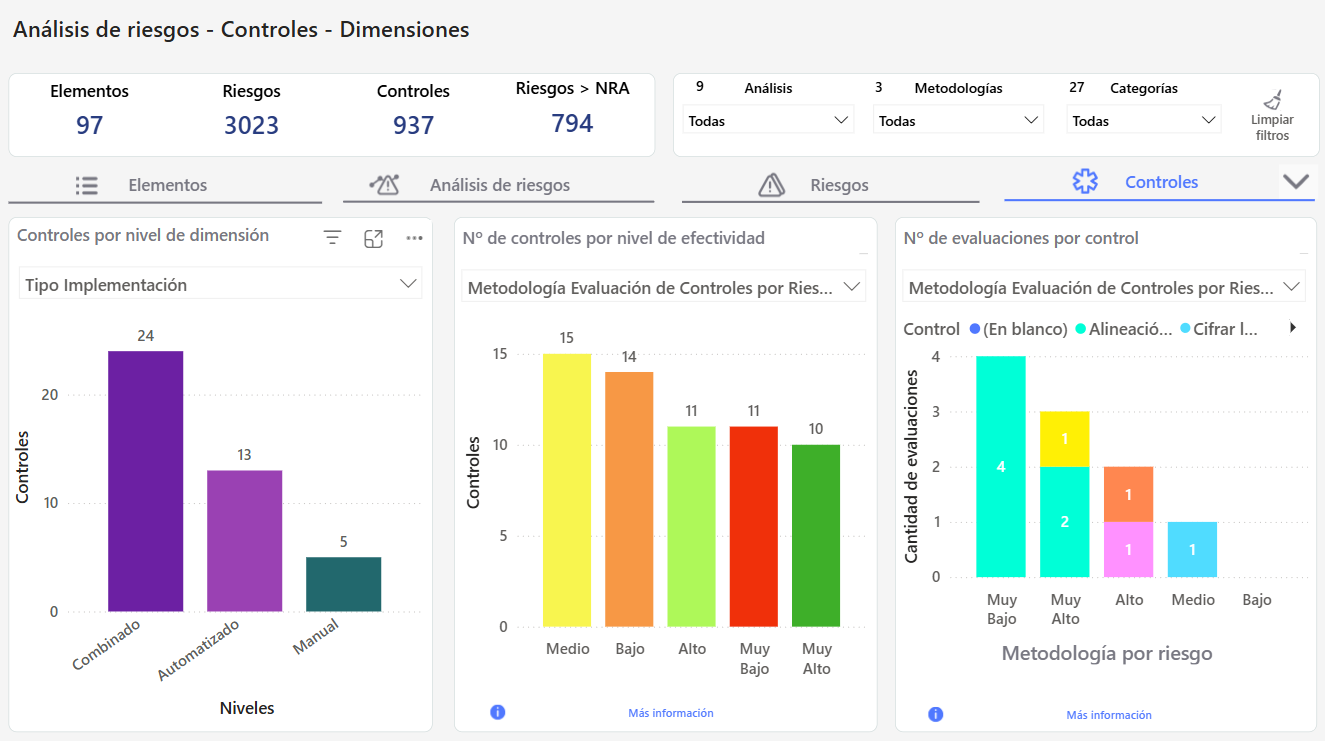
More Information
This option provides a detailed breakdown of the data, allowing a deeper and more specific understanding of each control and its context in risk management.
Facilitates in-depth analysis without the need to navigate outside the dashboard.