Loss Events can be generated manually or through the classification of open Tickets when the Loss Event typology is defined.
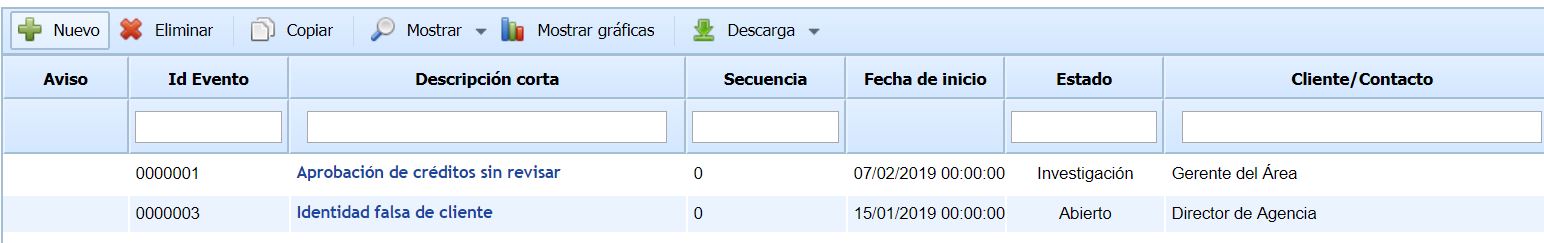
On the main Loss Events screen, all events that are in the 'Open' or 'Investigation' state appear (these are states configured with the "Initial" or "Intermediate" state type), as well as the following options:
-
New: Allows generating Loss Events.
-
Delete: Allows deleting Loss Events.
-
Copy: This option allows copying the record of a previously defined Loss Event.
-
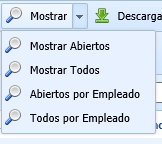
Show: By using GlobalSuite as a knowledge database, this option allows you to select to display only those that are open or all through the dropdown available in this option, as well as filter by the employee assigned to the Loss Event.
-
Download: Allows downloading the list of loss events represented in the view (depending on the filters you have set) in Excel or CSV format. This report will be available in Pending Downloads.
-
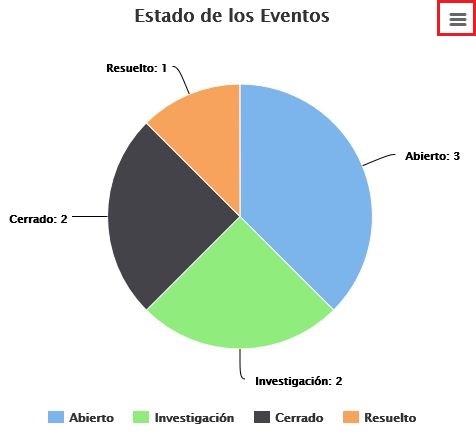
Show graphs: Offers different graphs based on the data of the existing loss event records. The following graphs are displayed:
-
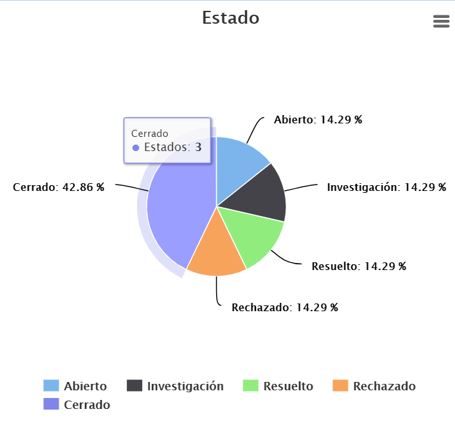
State: Allows visualizing the percentage of Loss Events in each state. By hovering over the graph, you can see the number for each state.
-
-
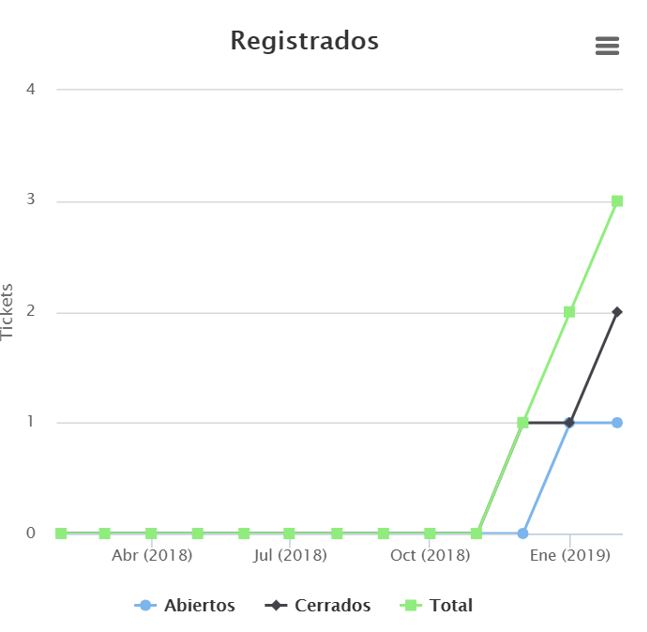
Registered: Allows visualizing in a single graph the total number of Loss Events for each month, those that are still open, or those that are already closed.
-
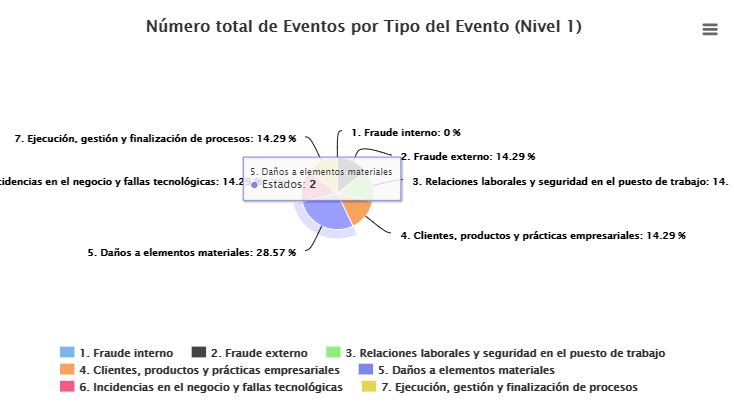
Event type: Allows visualizing the percentage of registered Loss Events classified under each "Event Type." By hovering over the graph, you can see the number for each state.
-
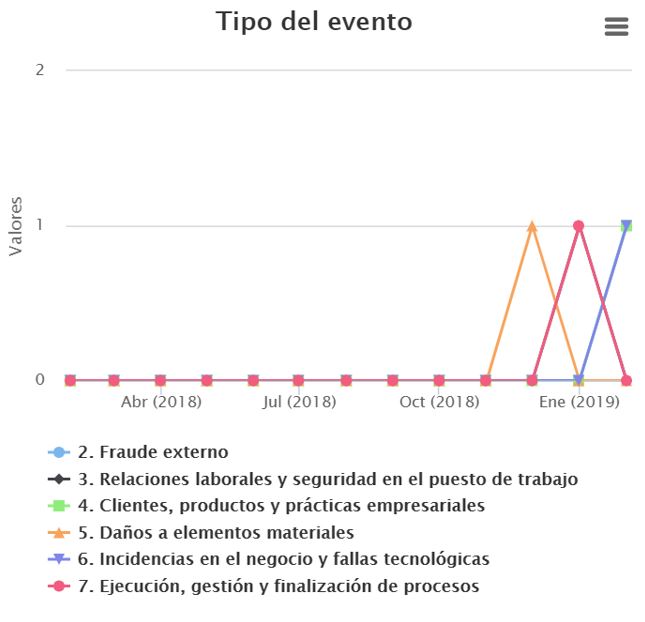
Event type: Allows visualizing the number of Loss Events registered each month and classified by "Event Type."
-
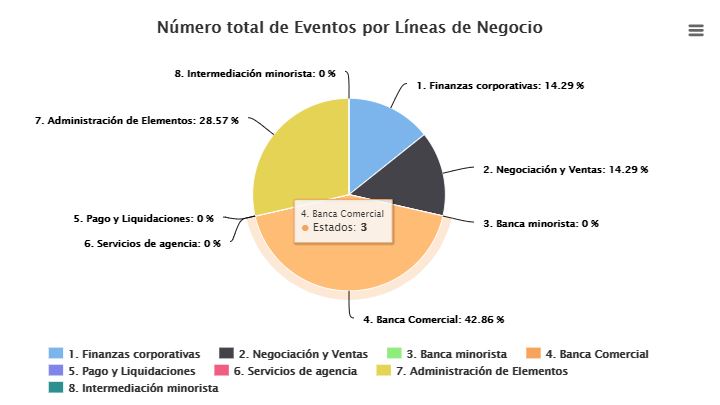
Business Line: Allows visualizing the percentage of registered Loss Events classified under each "Business Line." By hovering over the graph, you can see the number for each state.
-
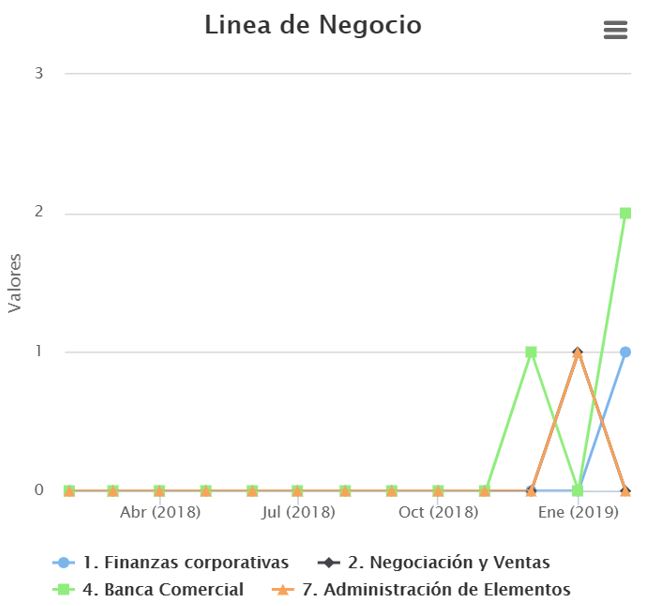
Business Line: Allows visualizing the number of Loss Events registered each month and classified by "Business Line."
-
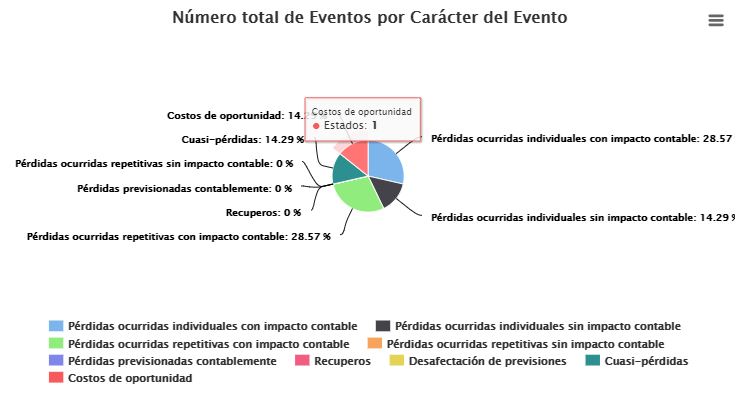
Event Character: Allows visualizing the percentage of registered Loss Events classified under each type defined as "Business Character." By hovering over the graph, you can see the number for each state.
-
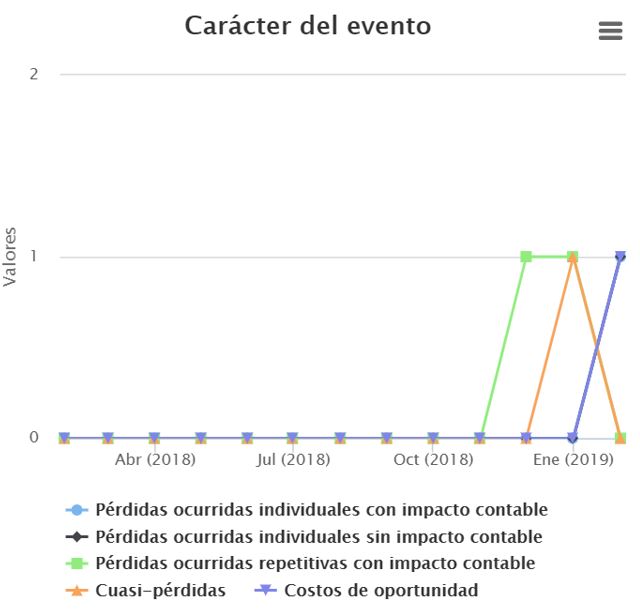
Event Character: Allows visualizing the number of Loss Events registered each month and classified by "Event Character."
-
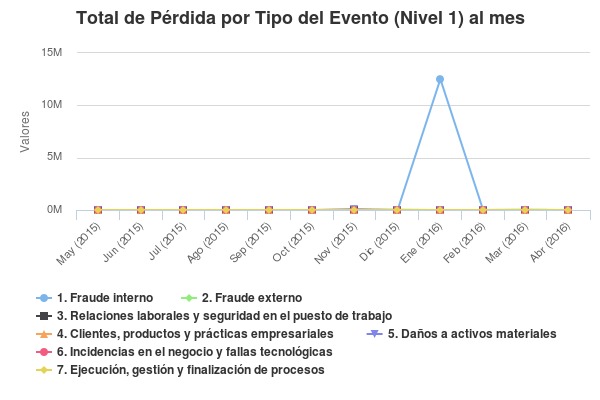
Total Loss by Event Type (Level 1) per month: Allows visualizing the total loss volume of Loss Events for each month and classified by "Event Type (Level 1)."
-
Comparison of Losses/Recoveries/Insurance: Allows visualizing the total volume of Losses, Recoveries, and Insurance of Loss Events for each month.
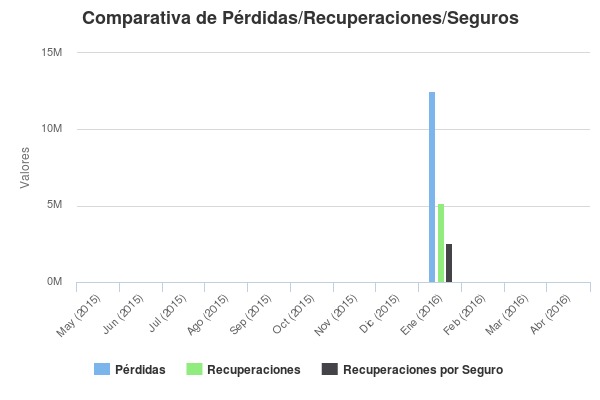
In the legend of each graph, you can deselect part of the information being displayed to customize the graph view. For example, if in the "Comparison of Losses/Recoveries/Insurance" graph you only want to view Losses and Recoveries, click on the legend for "Recoveries by Insurance" and the graph will no longer display that information. If you want the value of "Recoveries by Insurance" to reappear in the graph, you must click again on the type in the graph's legend.
All graphs can be printed directly or downloaded by clicking on the three-line symbol that appears in the upper right corner of each graph. The available formats are PNG, JPEG, PDF, and vector SVG.