In this section, you can monitor the status of Audit Plans and Works through a series of charts and reports.
By default, it shows all the information of all the works and audited items, but it is possible to apply filters to narrow these results:
-
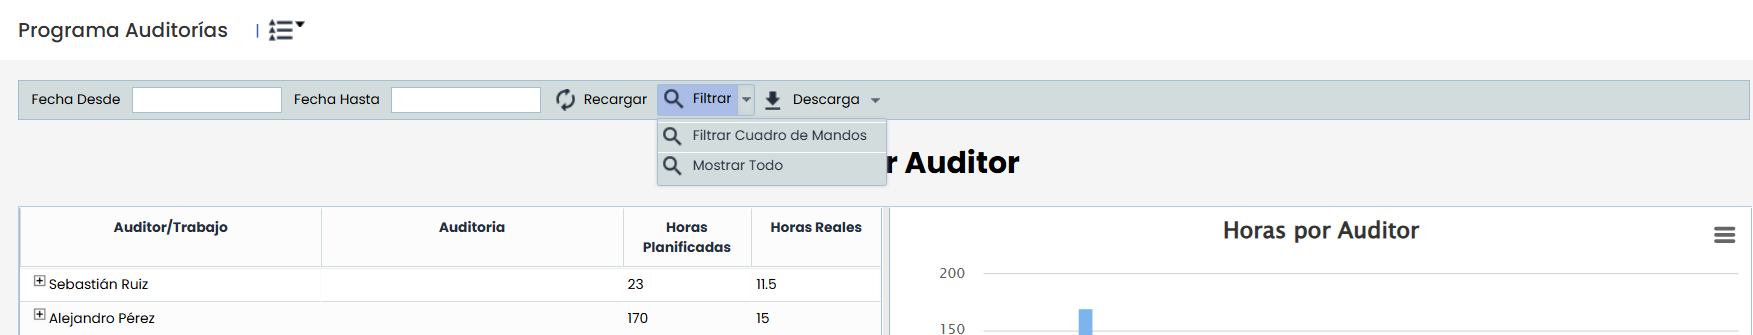
Date Filter: It is possible to filter the works performed before or after a specific date, which can be defined in the fields of the top bar. To apply the filters, you need to click the 'Reload' button. If you want to remove the filter, simply clear the dates and click the button again.
-
Item Filter: Additionally, it is possible to select which items we want to display on the dashboard, to narrow the information by the services, processes, areas, or assets you want to review.
-
To do this, if you click the Filter Dashboard button, a window will appear with the defined item tree, allowing you to select the ones you want to display.
-
If you have filtered items and want to view all the complete information, you must click Show All.
-
-
Download: In the dropdown menu, you have the option to extract the information of each chart into an Excel report. This report will be generated in the background and can be obtained in Pending Downloads.
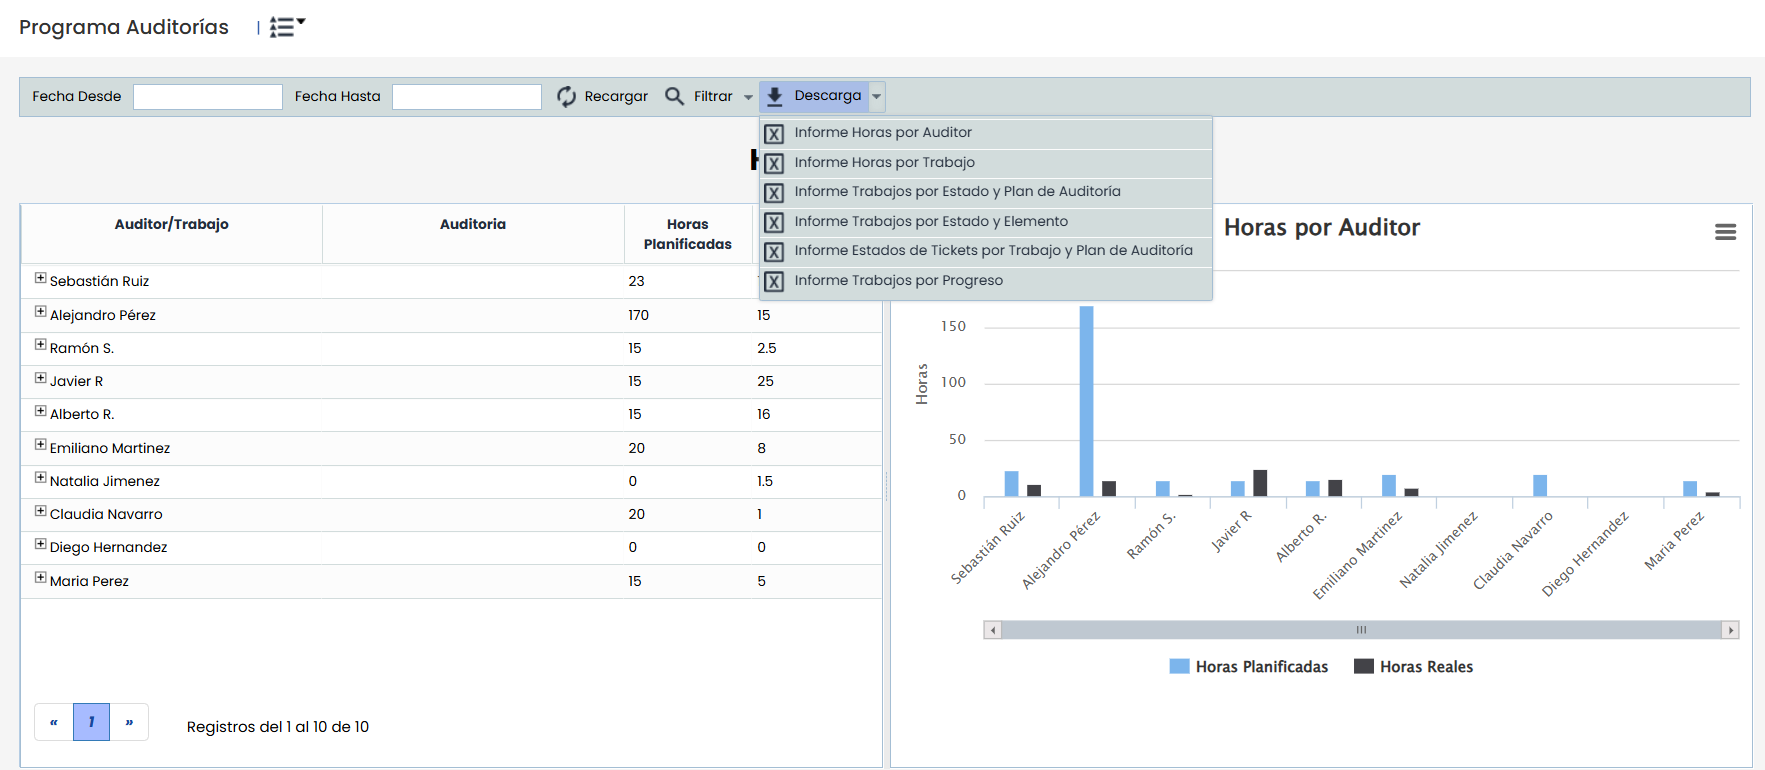
Next, the charts that are visible according to the configuration made will appear. These charts are:
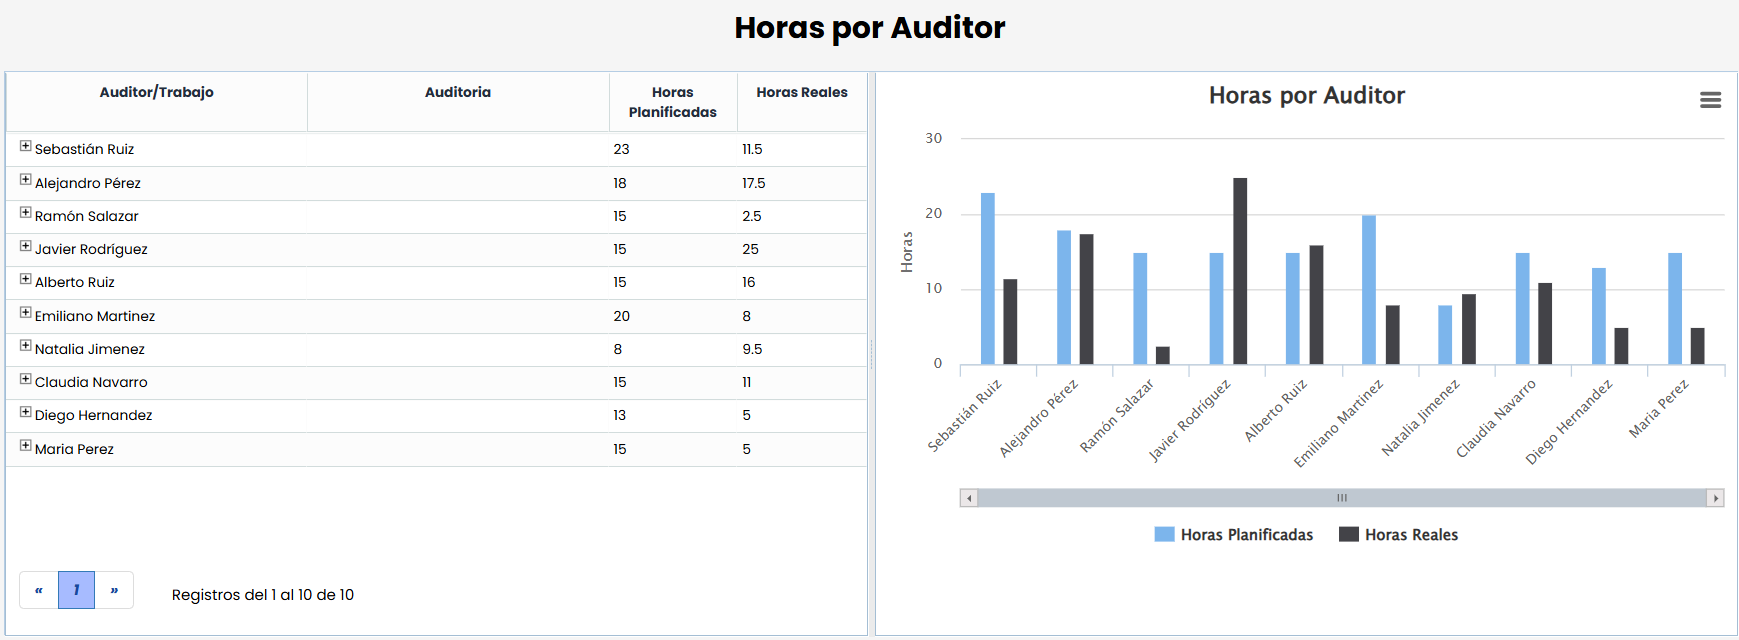
Hours by Auditor
It shows the allocation of planned and actual hours executed by the audit team members for each of the works.
The dashboard will consider two types of time records:
-
The records made manually through the Register Hours functionality.
-
The hour records linked to tasks of the projects in which the auditors participated.
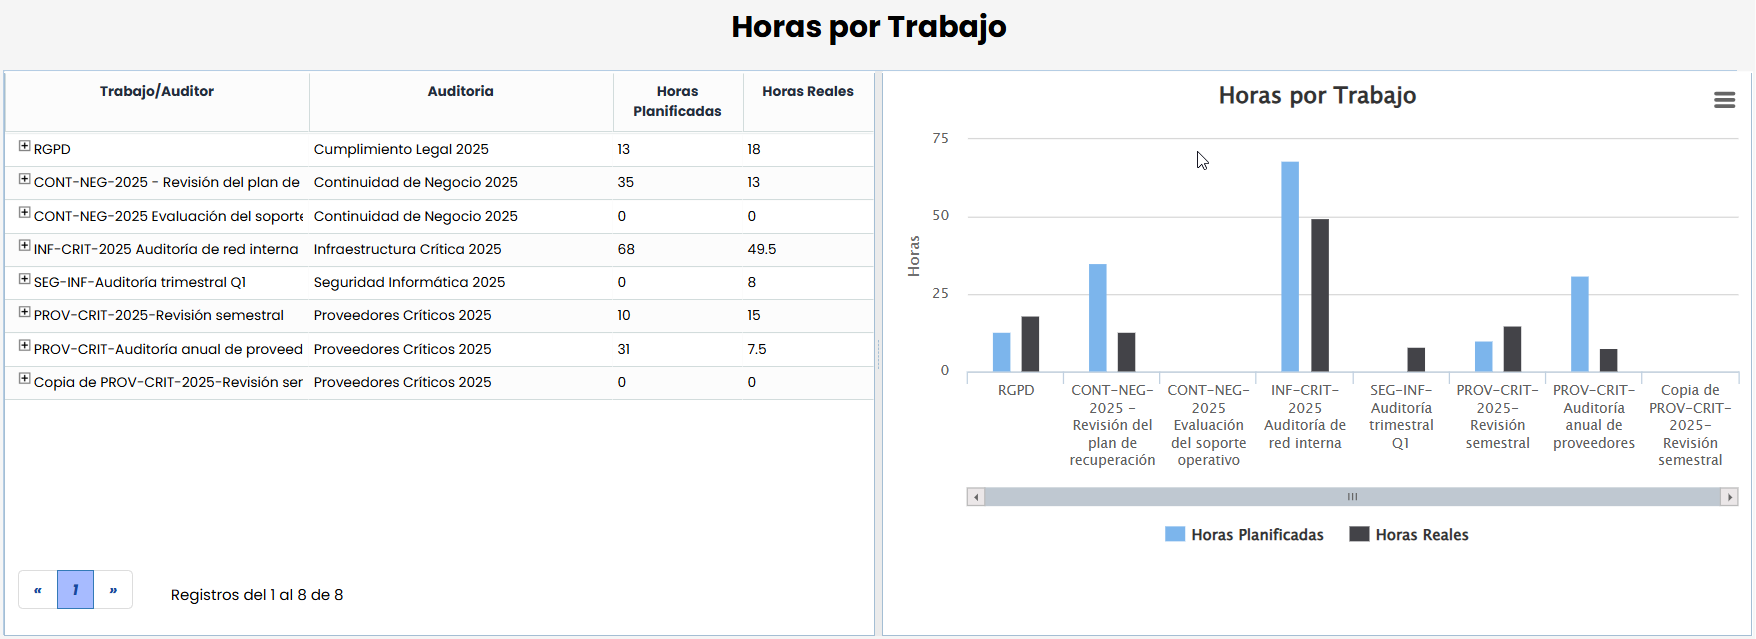
Hours by Work
It shows the planned and actual dedication of each of the audit works, based on the auditors' times.
The dashboard will consider two types of time records:
-
The records made manually through the Register Hours functionality within the work.
-
The hour records linked to tasks of the project associated with the work.
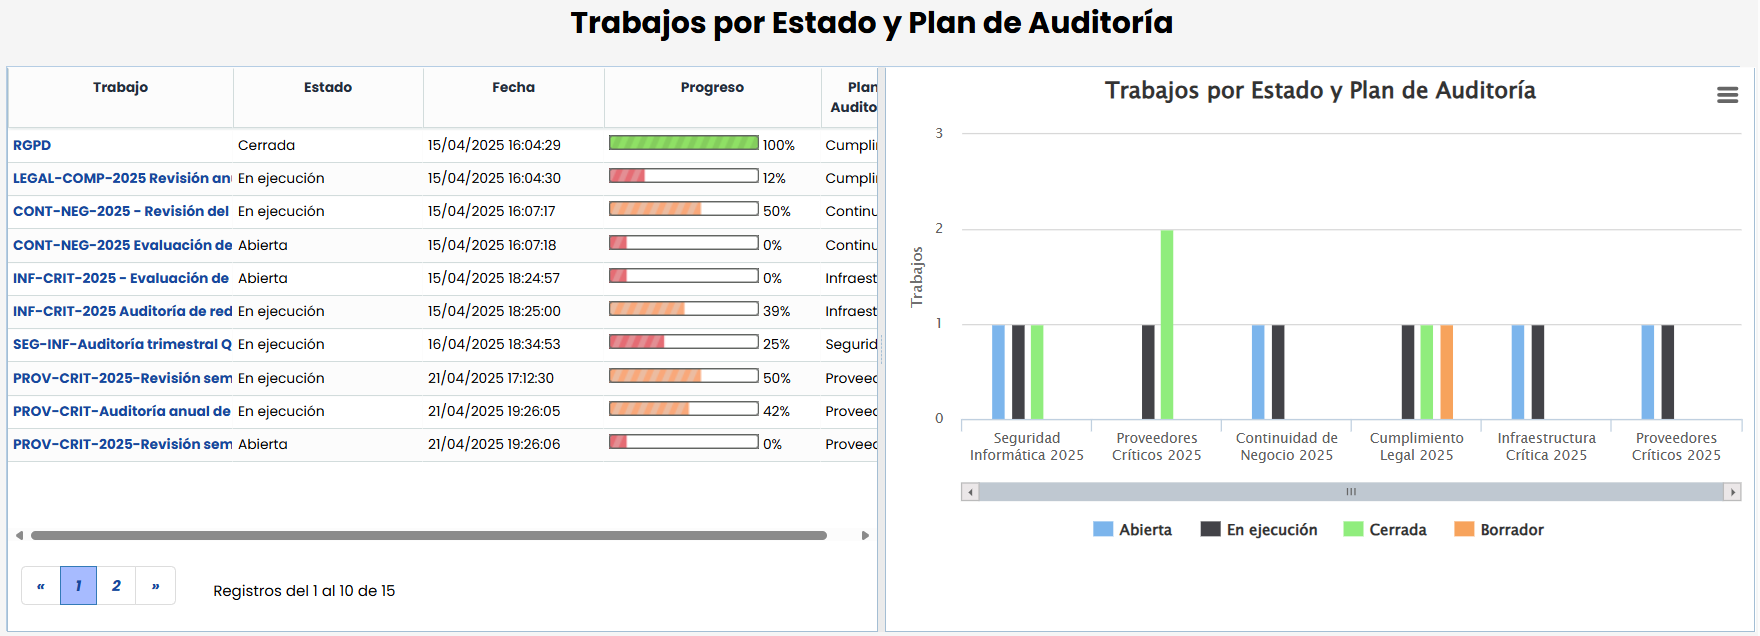
Works by Status and Audit Plan
This chart shows the status and degree of progress of each audit work, grouped by each Plan.
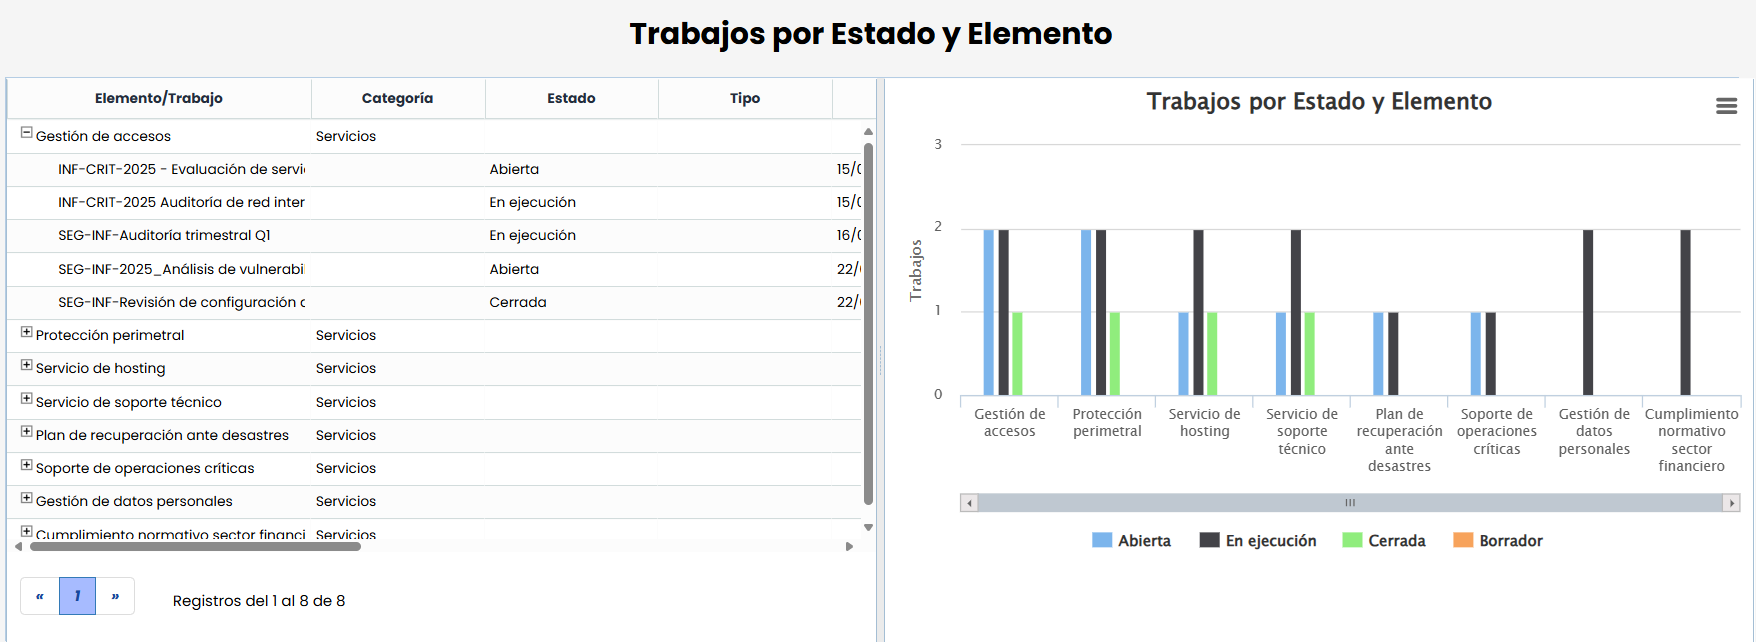
Works by Status and Item
Chart that shows in which works each of the audited items is included, and the status they are in (regardless of the Plan they belong to).
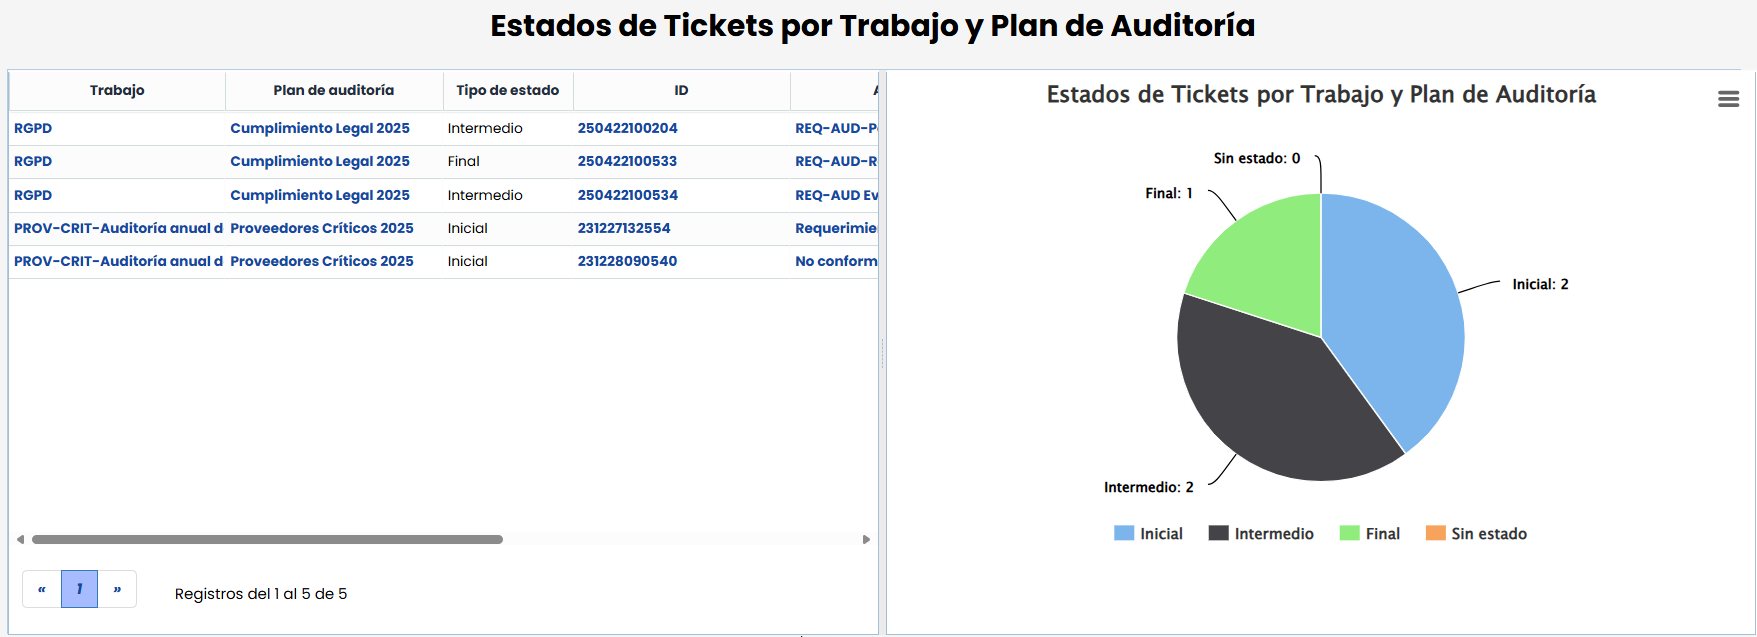
Ticket Status by Work and Audit Plan
This chart indicates how many tickets (Non-Conformities, Findings, Requirements, etc.) were generated in the audit works, and their current statuses.
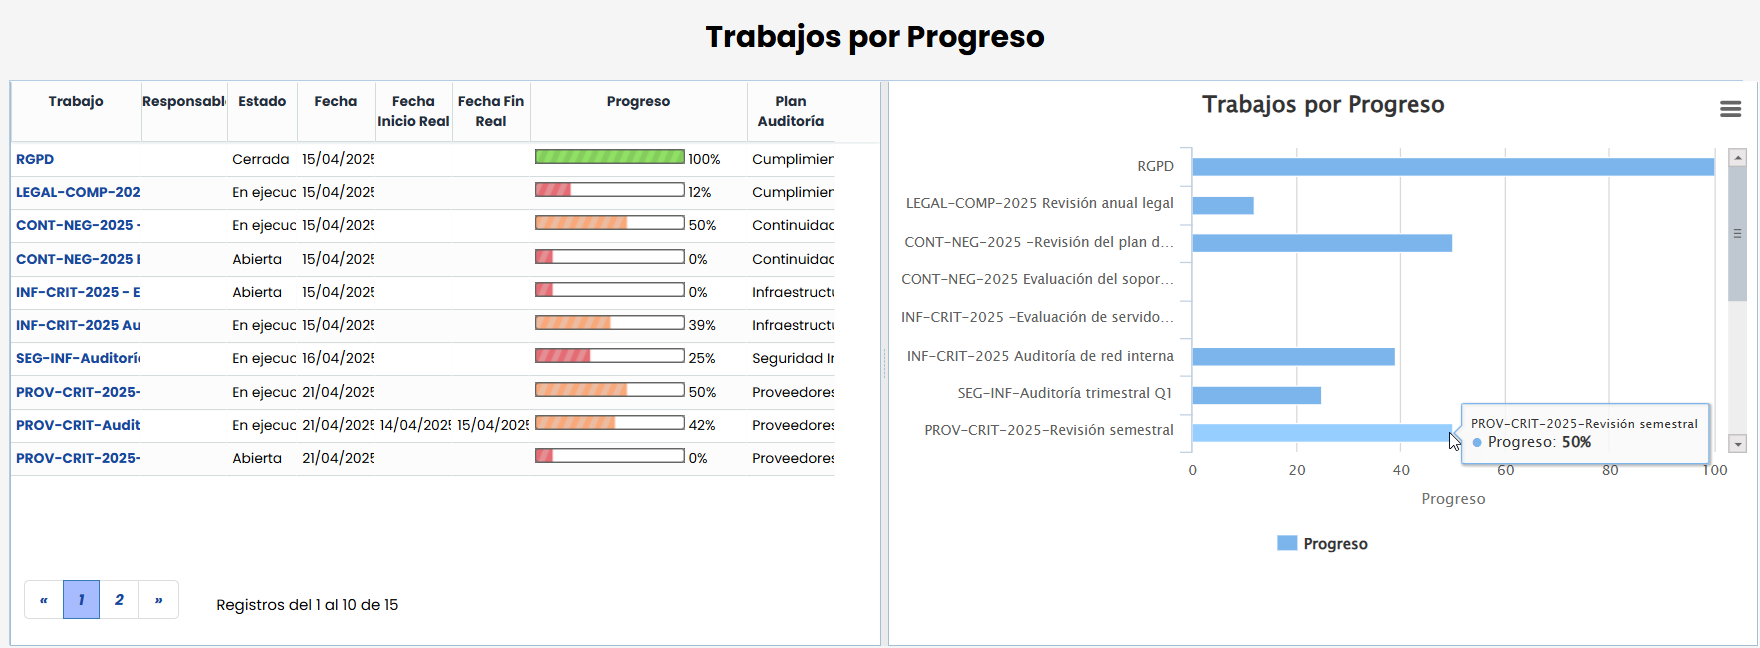
Works by Progress
This chart shows the percentage of progress or advancement of each audit work. This progress is determined based on the audit tasks or actions that have been planned.
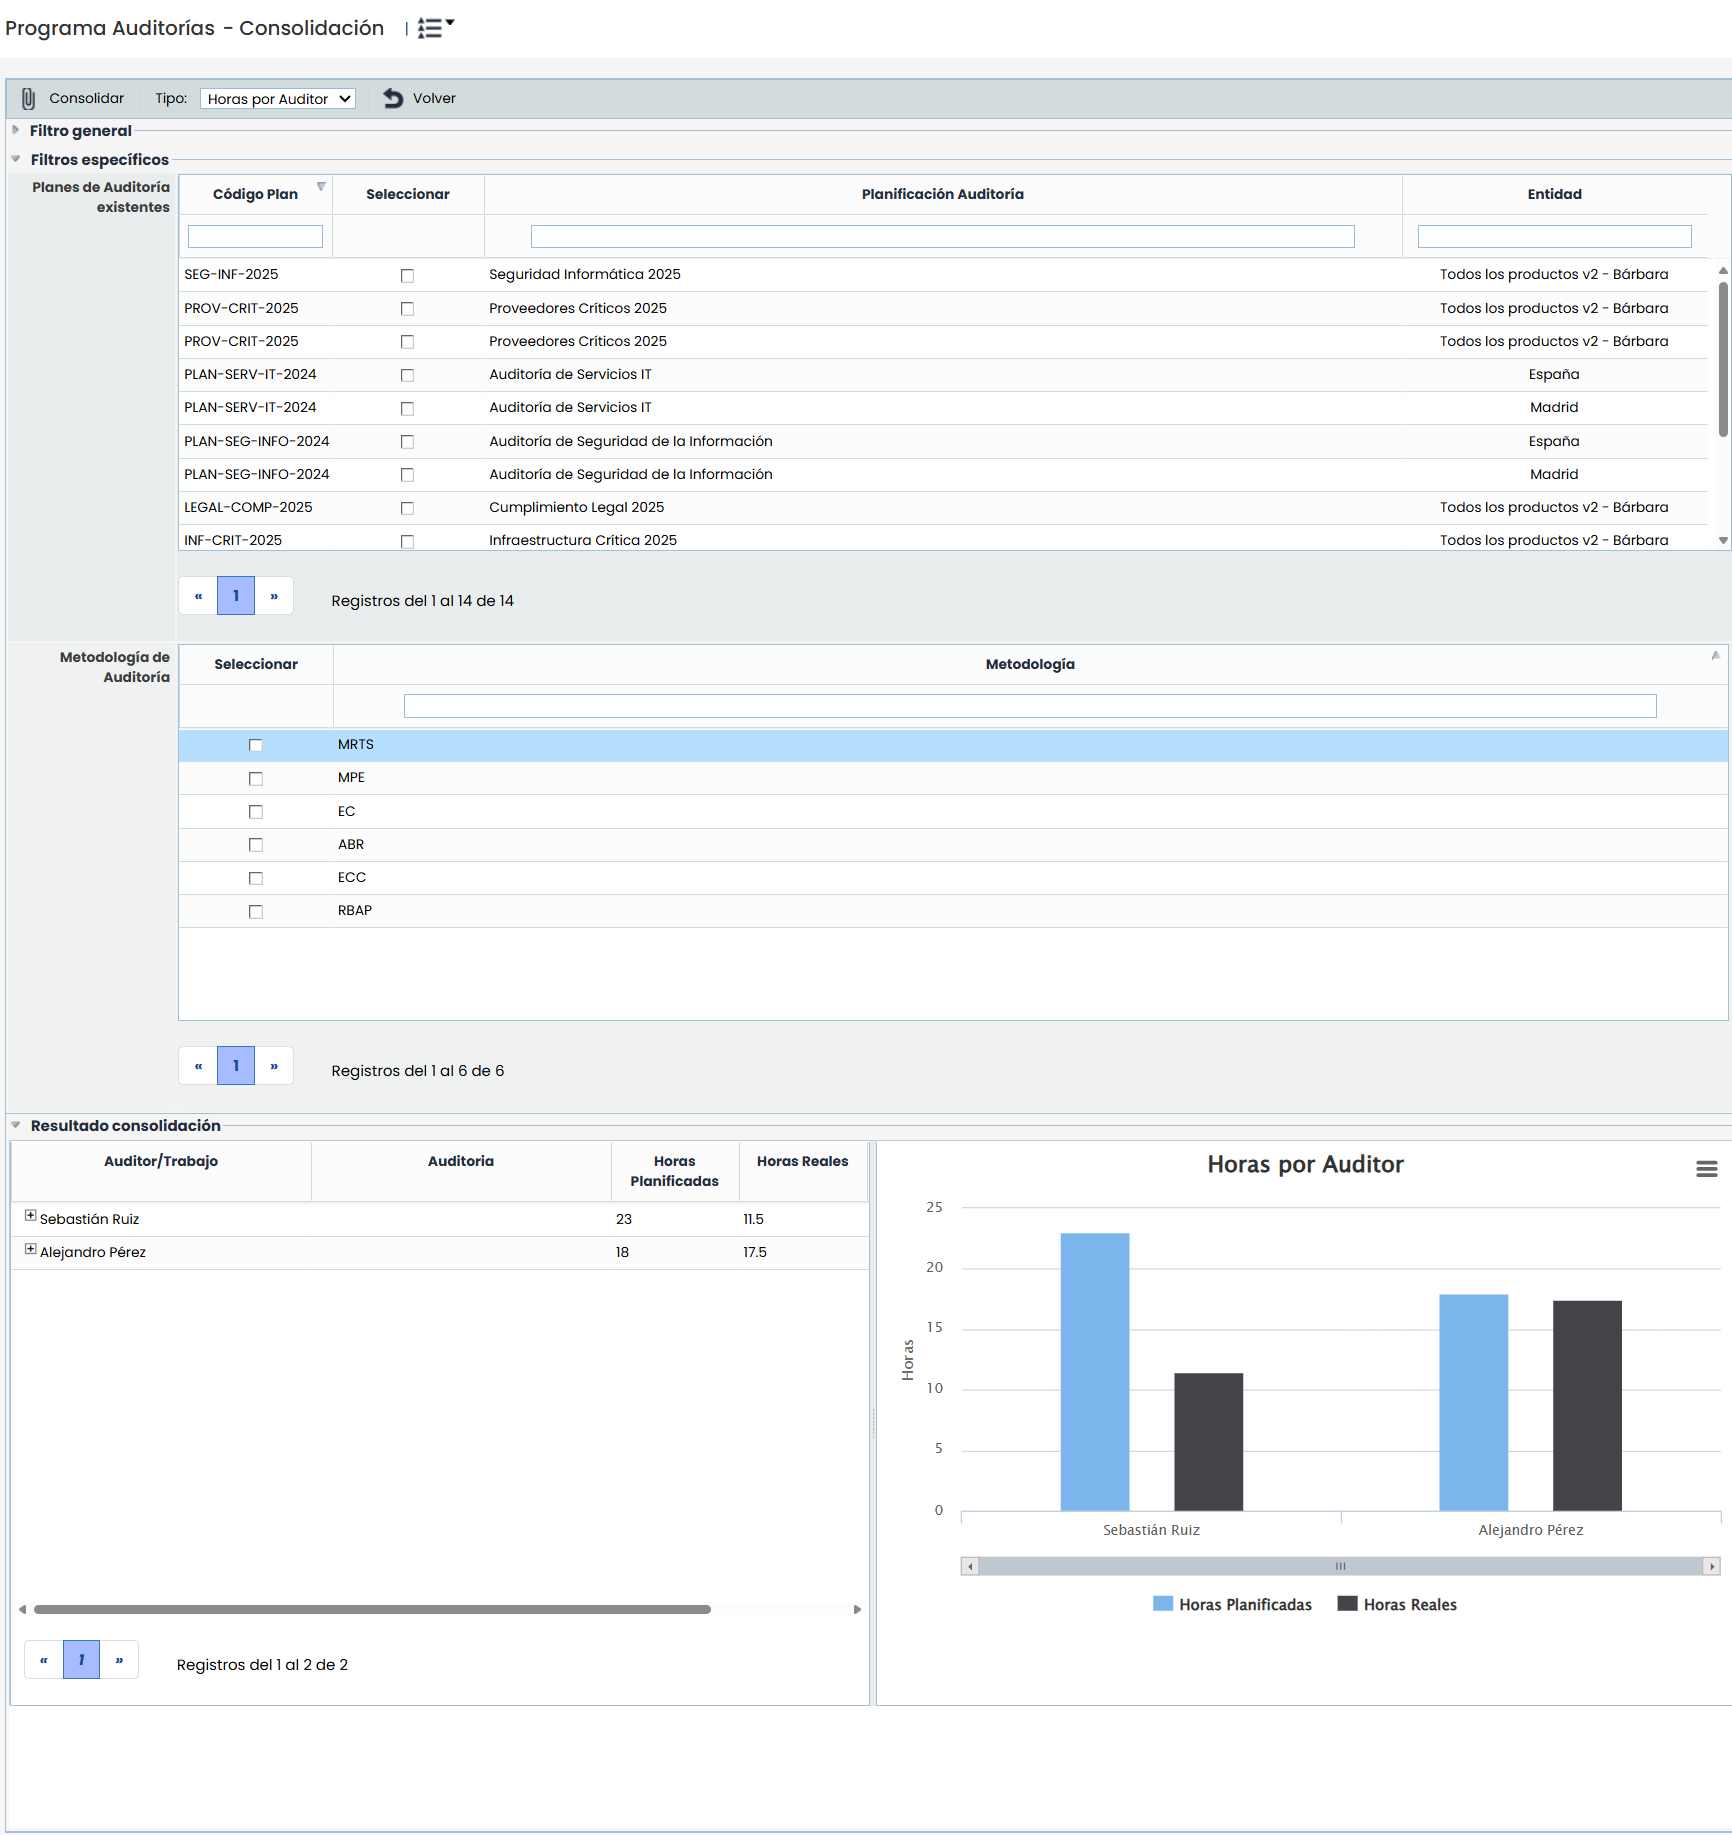
Audit Dashboard Consolidation
If you have a Subentities structure, it will be possible to compare the different charts among each of the subentities. To do this, you need to click on the 'Consolidation' section that will appear in the top menu.
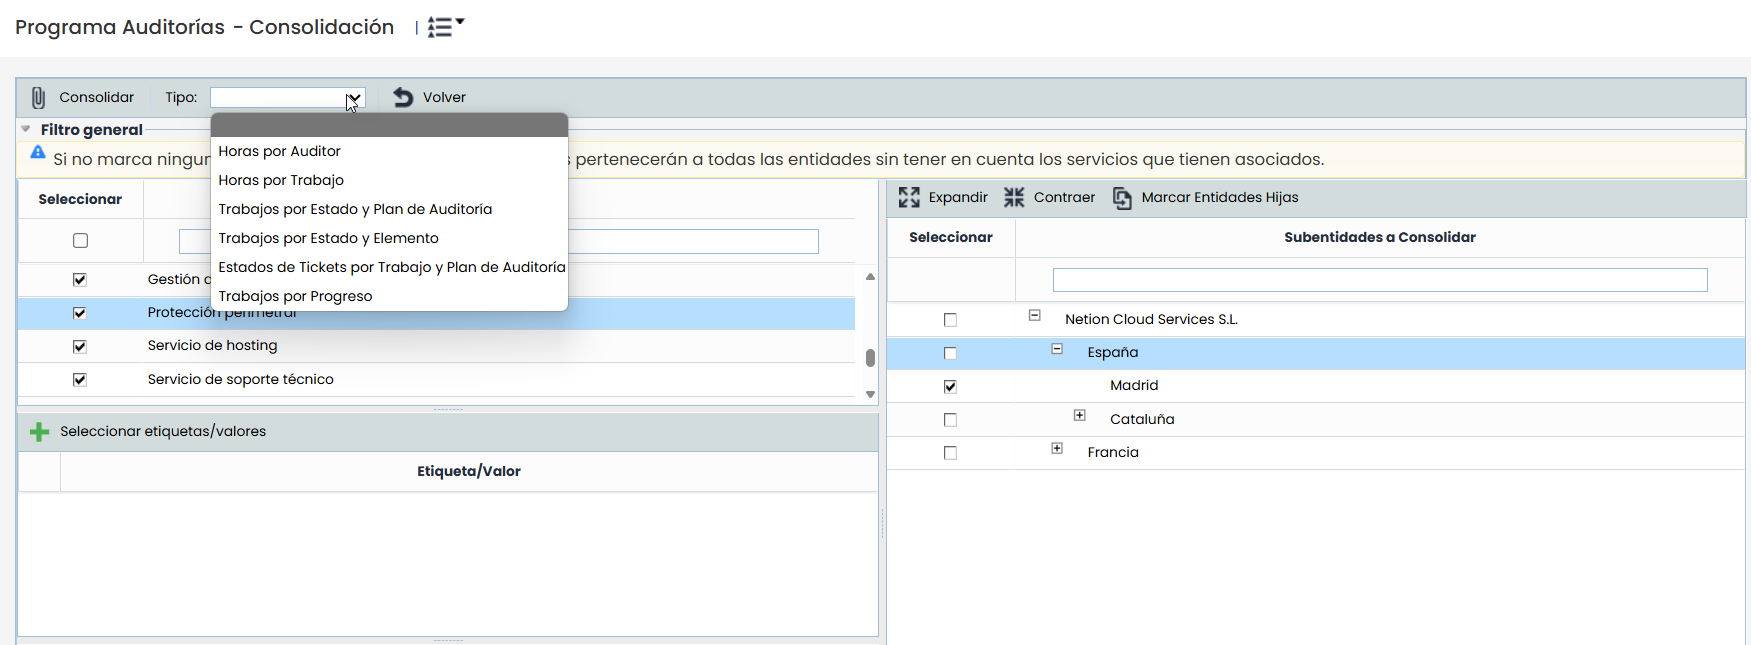
Once inside, you can consolidate information among the different subentities by selecting which Dashboard chart you want to view and clicking 'Consolidate'. You can apply several filters to limit the chart results.