By selecting a risk analysis from the initial table, the following information is accessed:
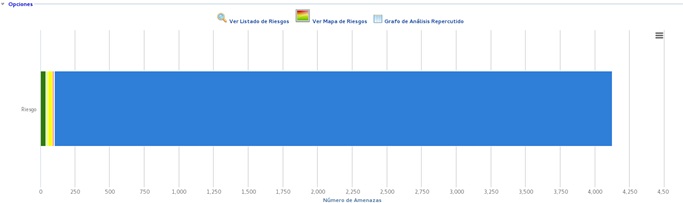
The tool displays the Risk Map (or heat map) with the risks identified in the 'Risk Analysis' option.
.jpg?cb=c79dea08a5ebc53e40c649000e42dd0d)
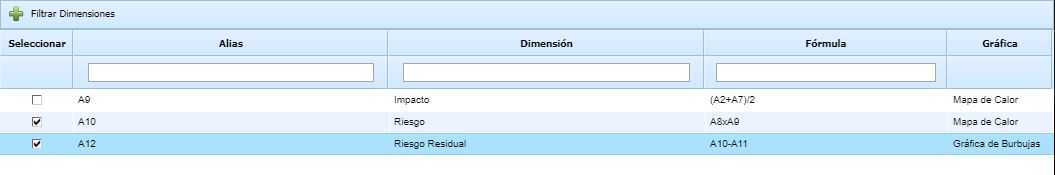
In the upper section, a matrix of the dimensions defined to calculate the risk is displayed, based on the analysis methodology defined in the 'Settings/Analysis Methodologies' section.
At the top of the Risk Map, there are several options that allow configuring the information to be displayed on the Risk Map:
-
Select Dimensions: Allows selecting several automatic dimensions that are defined based on two other dimensions, enabling multiple heat maps simultaneously. Additionally, it allows selecting whether any of the charts should be represented as a Heat Map or as a Bubble Chart.
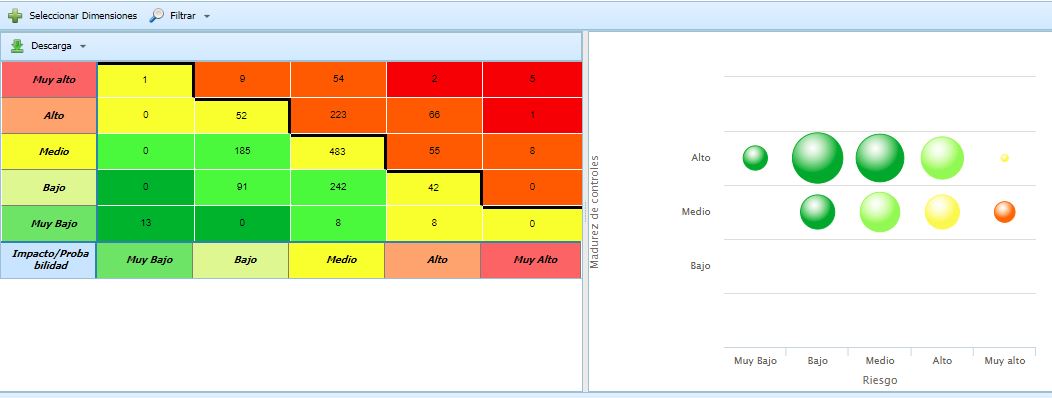
Once the dimensions to display are selected, all the charts are represented:
-
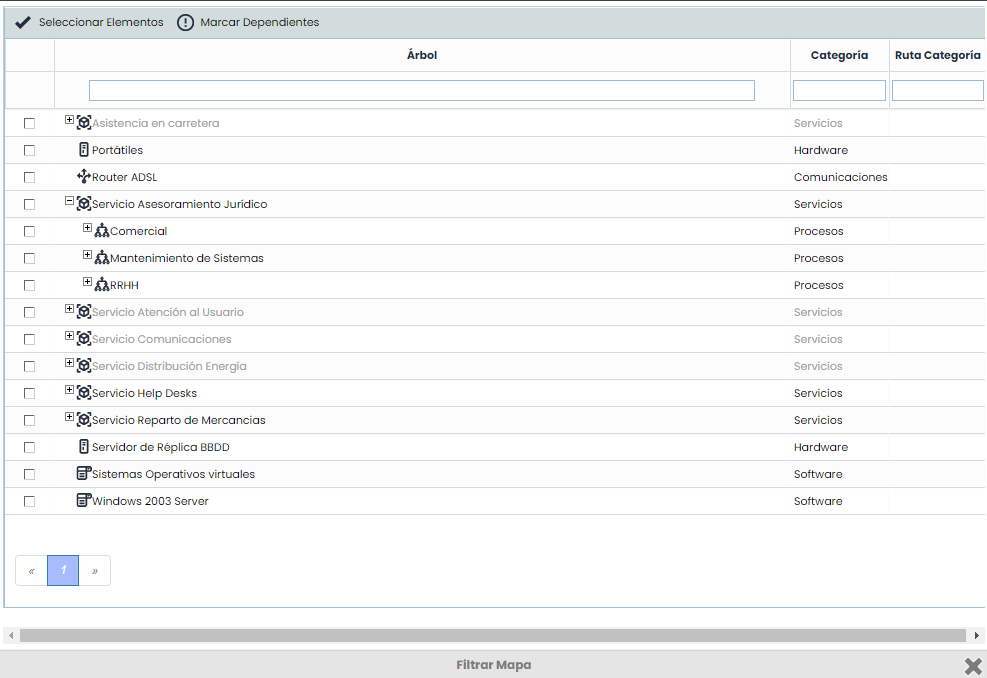
Filter Map: Allows selecting the elements that will be part of the Risk Map. This enables obtaining a Risk Map with only the risks associated with the selected elements.
-
Show All: Allows displaying the complete Risk Map of the Risk Analysis. This is the default option executed when entering the option.
Depending on the types of dimensions used in the methodology for risk calculation (qualitative or quantitative), the charts displayed by the tool to represent the Risk Map are different:
-
QUALITATIVE Dimensions and QUALITATIVE or QUANTITATIVE risk value
.jpg?cb=1bc46f7dfa579d28a79fcaa15330e1dc)
-
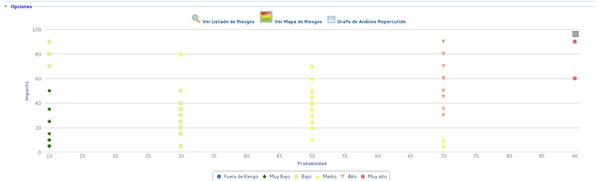
QUALITATIVE Dimensions or one QUALITATIVE and one QUANTITATIVE dimension and QUANTITATIVE risk value
-
QUANTITATIVE Dimensions or one QUALITATIVE and one QUANTITATIVE dimension and QUANTITATIVE risk value
NOTE: The Risk Map option is only displayed when the risk level has been configured based on two dimensions.
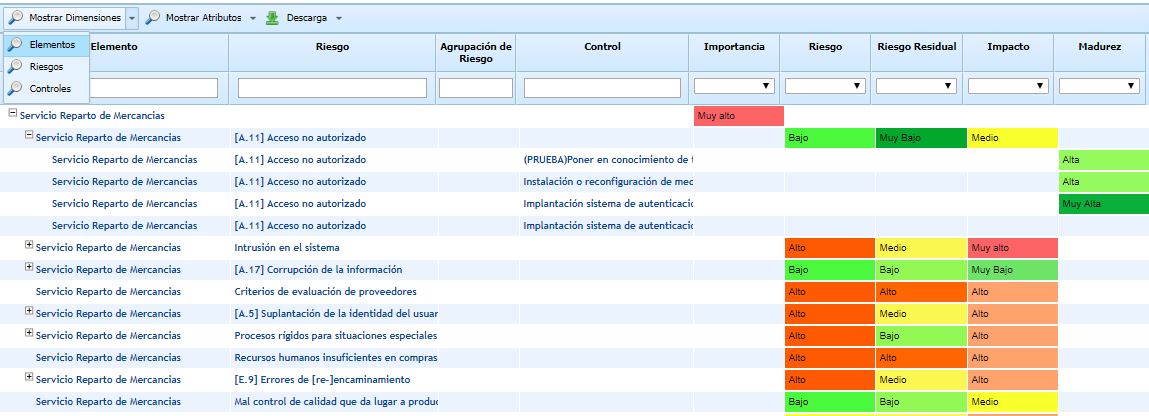
On the other hand, in the lower screen, the list of elements, risks, and controls that are part of the upper Risk Map is displayed. This table contains the following buttons:
-
Show Dimensions: Allows selecting which dimensions (quantitative or qualitative) of the Elements, Risks, or Controls will appear in the list. By default, the dimensions configured in the Settings section are visible.
-
Show Attributes: Allows selecting which textual dimensions (attributes) of the Elements, Risks, or Controls will appear in the list.
NOTE: Heat Maps can be downloaded in Excel format.
The list of Elements-Risks-Controls can be downloaded in CSV format. There are two download options:
-
CSV Table: Downloads a CSV file with the columns of dimensions and attributes that are visible at that moment.
-
Complete CSV Table: Generates a report with all configured dimensions and attributes, even if they are not visible at the moment.
This CSV format is a standard that allows the exploitation and transfer of risk information to other systems, facilitating interconnection and exploitation.
In upcoming versions, new reports in this standard CSV format will be incorporated.
If you want to convert the downloaded report into Excel format, you can do so by following these steps:
-
Open the .csv file downloaded from GlobalSUITE® that you want to convert.
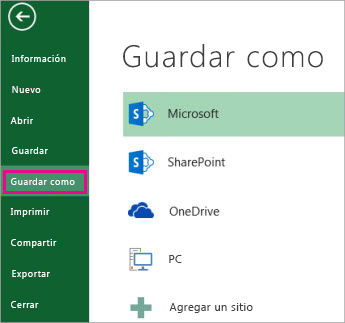
-
Click on File > Save As.
-
In Locations, select the place where you want to save the file.
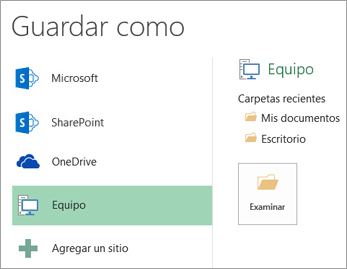
-
In the Save As dialog box, navigate to the desired location.
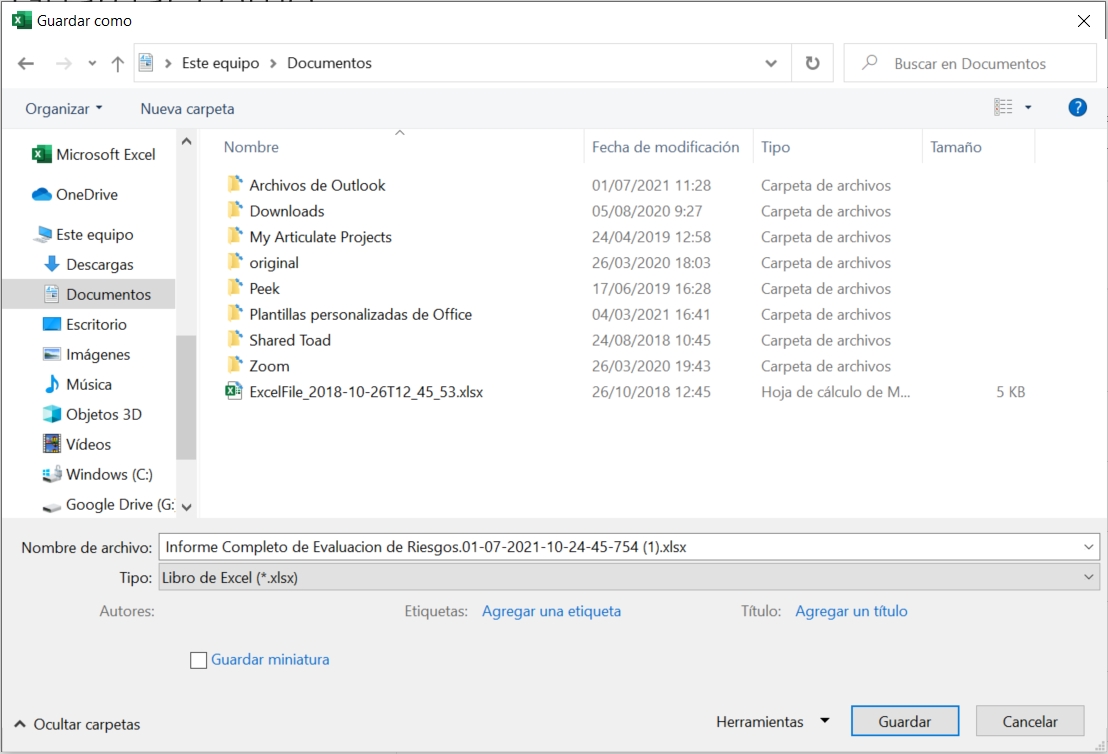
-
In the Save as type list, click on the file format " Excel Workbook (*.xlsx) ". Click the arrows to scroll to file formats not visible in the list.