This option allows us to configure a series of charts in order to view a summary of the status of the different types of tickets with respect to some of their fields.
We have the following types of charts:
-
General (Ticket): Charts available in the Ticket options of any Management System.
-
Status: Creates a chart based on the records of the "Status" field or any of the "SELECT" type fields. (By default, the "Status" field)
-
Registered: Creates a chart based on the records of the "Status" field or any of the "SELECT" type fields, organized monthly. (By default, the "Status" field, at least one "Date" field must also be configured, and it must be of the Initial type)
-
Registered by Year: Creates a chart based on the records of the "Status" field or any of the "SELECT" type fields, organized annually. (By default, the "Status" field, at least one "Date" field must also be configured, and it must be of the Initial type). The chart only shows data for the current year. To view information from previous years, it is necessary to use the date filter.
-
Registered by Type: Creates a chart based on the records of the "Status" field or any of the "SELECT" type fields, showing the evolution of tickets registered per month for each of the Select options.
-
Registered by Type (Sectors): Creates a chart similar to the previous one where, based on the records of the "Status" field or any of the "SELECT" type fields, it shows in a pie chart the number of tickets for each one.
-
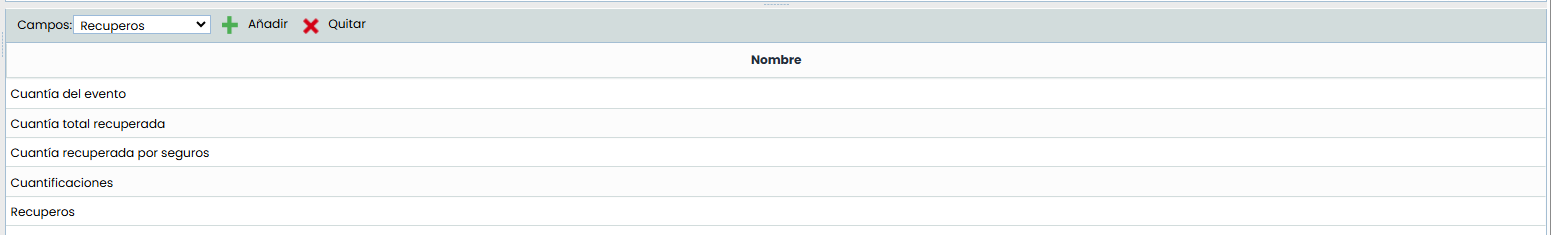
Comparison: Creates a chart where the evolution of the "NUM" type fields we select can be compared, by months.
-
Summation: Creates a chart where the summation of the selected "NUM" type field will be displayed, by months.
-
In the Comparison and Summation charts, you can select which numeric fields will be included in the chart, in the table below (in the Summation chart, only one field can be selected):
-
Consolidated (Consolidation): Charts available in environments with multiple sub-entities, allowing the consolidation of information from all of them.
-
Grouping by Select: Creates a chart based on the records of the "Status" field or any of the "SELECT" type fields. (By default, the "Status" field)
-
Outputs: Creates a chart based on the records of the "Status" field or any of the "SELECT" type fields, related to the Output Tickets specified in the "Tickets-outputs" field. (By default, the "Status" field, at least one "Date" field must also be configured, and it must be of the Initial type)
-
Outputs by Deadline: Creates a chart based on the records of the "Status" field or any of the "SELECT" type fields, related to the Output Tickets specified in the "Tickets-outputs" field. (By default, the "Status" field, at least four "Date" fields must also be configured, each with one of the available types: "Initial", "Final", "Planned Start", "Planned End")
-
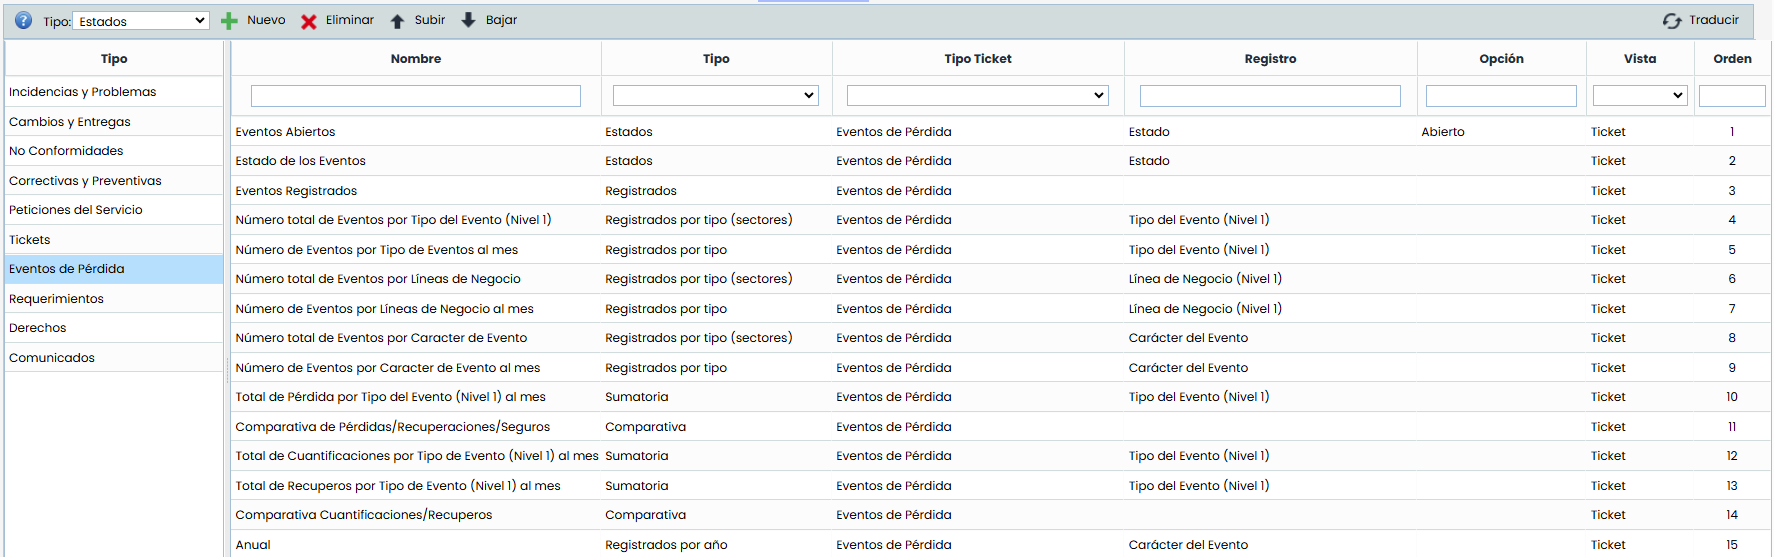
Some of the columns in this table are:
-
Name: Allows defining the name that will be displayed in the query section for this chart, which will help identify it. This name can be configured in any of the company's languages. To do this, you need to click the "Translate" button located in the upper right corner of the view.
-
Ticket Type: Allows us to define in consolidated charts, which type of output ticket the records are compared with. In Ticket type charts, this field will not be editable; it will only show in which ticket option it can be displayed.
-
Record: Allows us to indicate which field we want the charts to be based on, whether it is the "Status" field or all the "Select" type fields configured in the Ticket.
-
Option: Allows us to filter the chart with a specific value of the "Status" or "Select" fields of the Ticket.
-
View: Allows showing whether the chart will be displayed in the main table of the corresponding ticket type, or in the Consolidation section (if the environment has sub-entities).
-
Order: Shows the order in which the charts will be loaded in the corresponding view. To adjust this order, you can click the "Move Up" and "Move Down" buttons, which will change the order of the selected chart.