Features and improvements included:
- Expansion of the Communications Dashboard : The initial dashboard functionality is expanded with new charts.
-
New charts available:
-
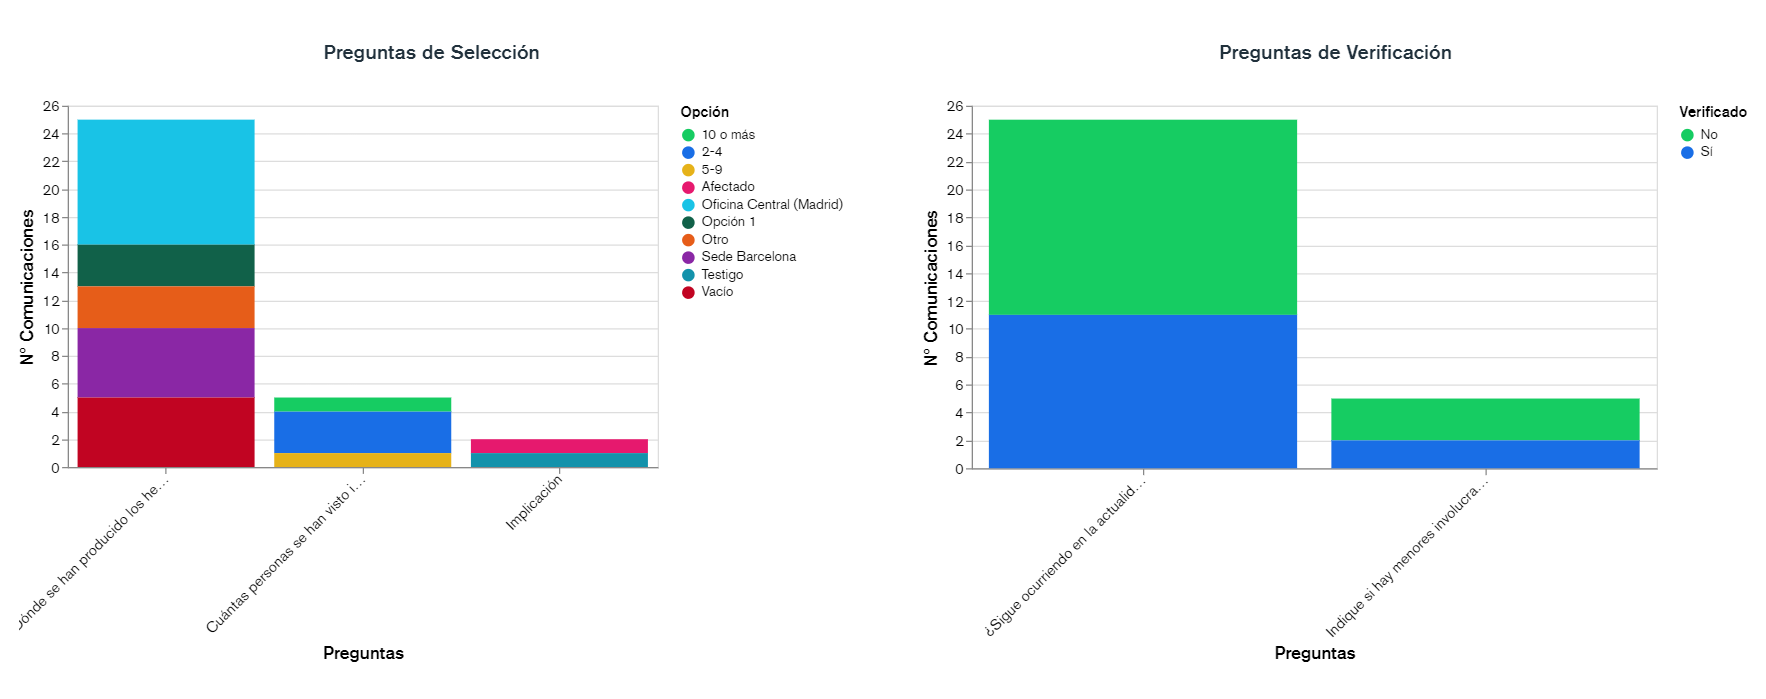
Selection questions: Bar chart to check, for dropdown-type questions, how many communications have each option selected.
-
Verification questions: Aggregation chart to determine in how many communications each question has been marked.
-
-
As with the previous ones, it is possible to configure which charts are displayed on the initial view, enabling/disabling them, and adjusting the display order.
-
Now, the default date range displayed corresponds to the last year, and the period for which information is to be consulted can be adjusted.
- General usability improvements:
-
Storage of a user's column selection: Now the selection of which columns are visible in the main Communications view is remembered throughout the user's work session.
When a user accesses for the first time, the columns enabled by default (defined in Settings) will be displayed.