New features and improvements in GlobalSuite® GRC
Automation of survey sending from Risk Analysis - New templates
The functionality for automated survey sending from Risk Analysis is expanded with support for two new types: “Risk Survey” and “Element-Risk Survey”.
In the configuration of survey models of type “Risk Survey” and “Element-Risk Survey”, the option “Use as template” has been added, allowing the automation of survey sending from a Risk Analysis.
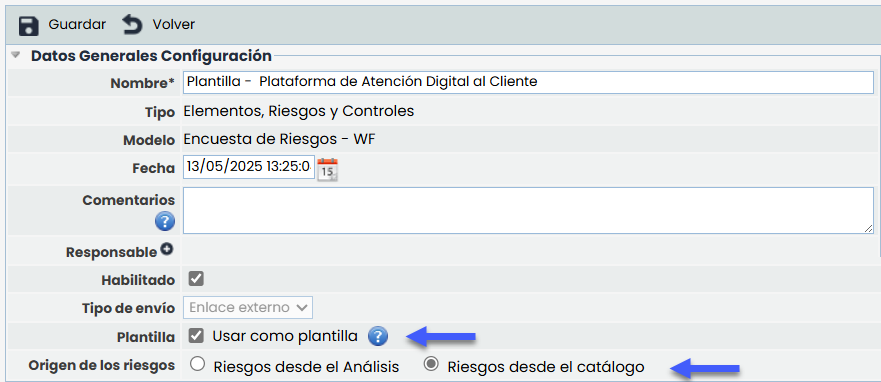
When this option is activated, the field “Risk Source” is enabled, with two mutually exclusive alternatives: “Risks from the analysis” and “Risks from the catalog”. Depending on the selected option, the form adapts automatically. If “Risks from the catalog” is chosen, the selection of a specific analysis is enabled, and a hierarchical table is displayed with risks structured by Catalog > Category > Risk.
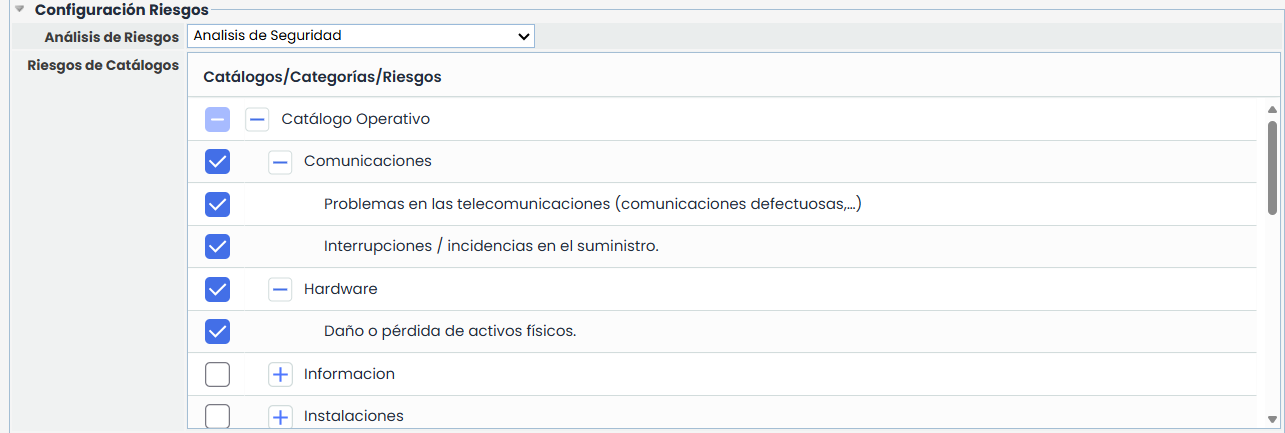
The system includes validations to ensure the selection of both the analysis and at least one risk before being able to save the template.
On the other hand, if “Risks from the analysis” is selected, the survey will be sent automatically with all the risks associated with the element selected within the risk analysis.
New functionalities and improvements in GlobalSuite® Business Intelligence
Improvements and adjustments have been incorporated into the Tickets tab of the TPRM Dashboard , aimed at enhancing the visibility and analysis of tickets related to suppliers. These updates strengthen the dashboard's utility as a comprehensive monitoring tool, adding new charts, interactive functionalities, and visual enhancements.
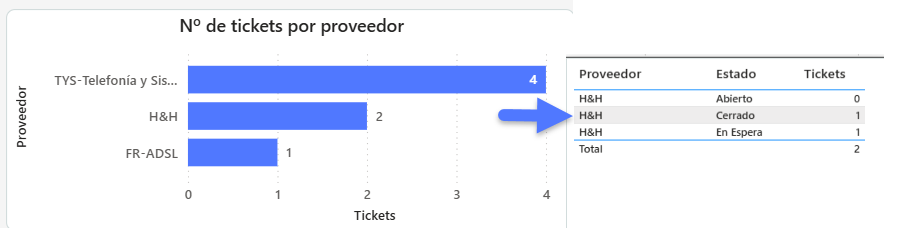
New Chart "No. of tickets per supplier"
A new visualization in horizontal bar format has been added, allowing quick consultation of the volume of tickets associated with each supplier.
-
In this chart, each bar represents a supplier, and its length indicates the total number of tickets recorded. Suppliers are listed vertically and sorted in descending order based on the number of associated tickets.
-
Hovering over each bar displays a tooltip with detailed information, including the supplier's name, ticket status, and the number of tickets, both by status and in total.
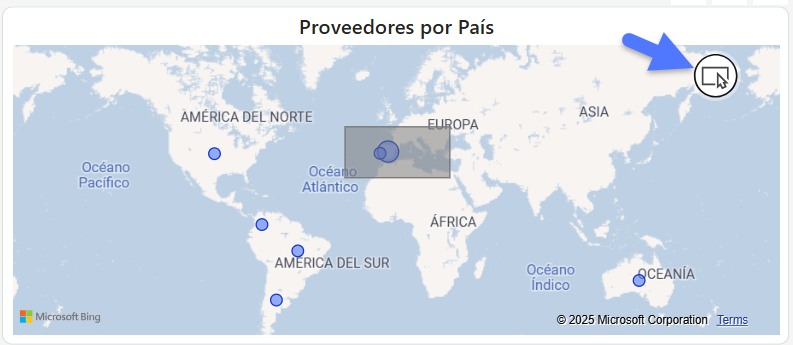
Region filter on the supplier map
A new region filter is included, allowing the geographical delimitation of supplier visualization through a lasso button (draw region) on the map.