
The Groupings tab allows you to compare the risk level of each risk grouping in the analysis against the ARL and TRL, to identify the groupings that concentrate the most risks or exceed the acceptable level and prioritize their treatment.
Access from Analysis > Risk Assessment, click on the name of the analysis and select the Groupings tab.
The risk level of each grouping is calculated using the criterion defined in the Risk Calculation by Risk Grouping field of the General Information tab of the analysis (Maximum, Minimum, Average, or Accumulated). See Information and Items. Risk groupings are defined in Settings > Analysis Catalogs . For example, with three risks valued at 20, 30, and 50 and the Maximum criterion, the grouping shows 50.
Charts
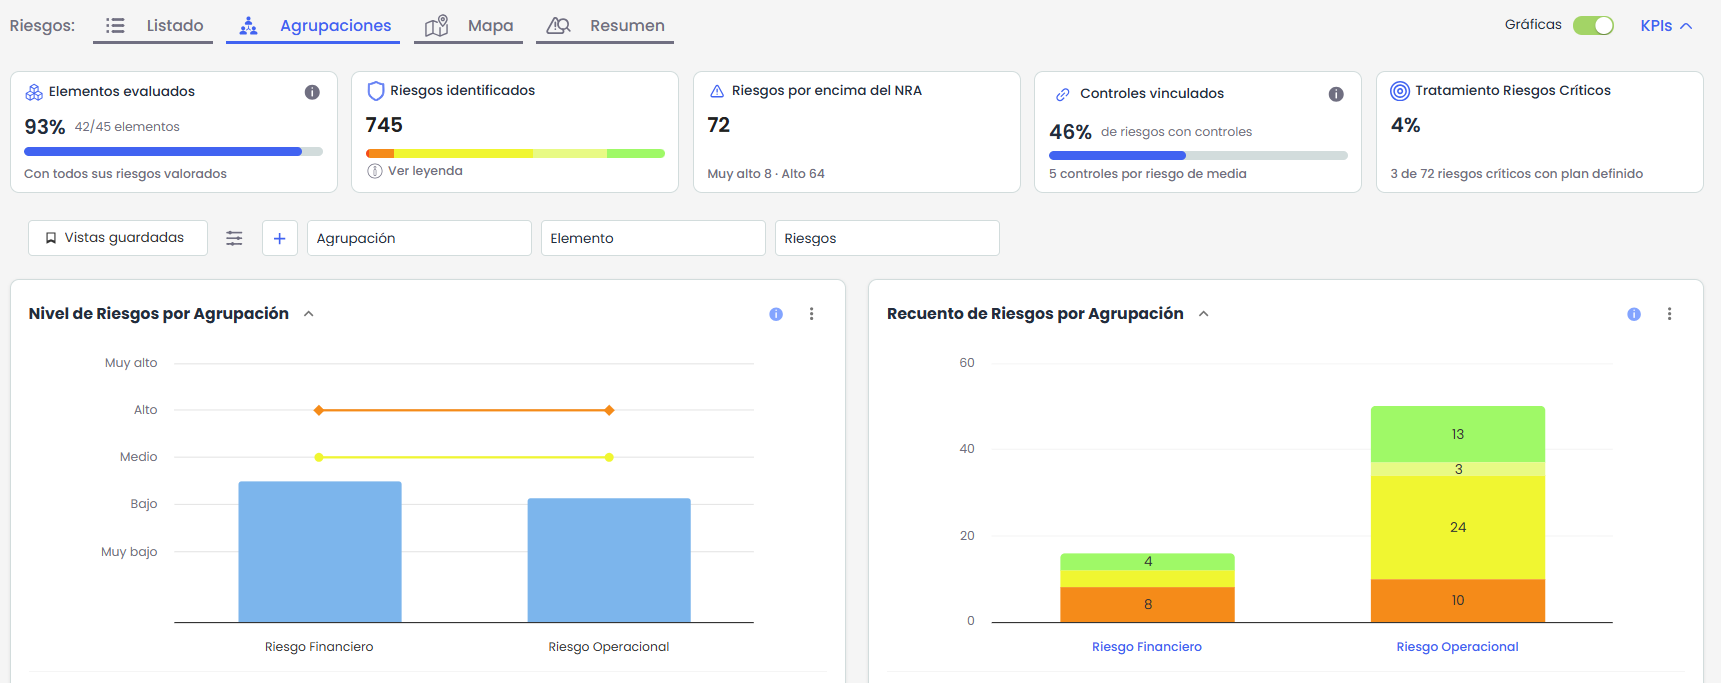
The top of the screen can display up to four charts, depending on the methodology used.
The Charts button allows you to show or hide the entire chart block.
-
Risk Levels by Grouping: displays the calculated risk level for each grouping. The ARL and TRL references help identify the groupings that exceed these values. If the analysis does not have ARL or TRL, the corresponding reference is not displayed.
-
Risk Count by Grouping: displays the number of risks included in each grouping, distributed according to the levels of the main risk dimension. In quantitative dimensions without levels, it shows the total number of risks.
-
Grouping Heat Map: is displayed when the main risk dimension is calculated from two dimensions with levels. Each cell represents the number of groupings that present a specific combination of levels. The ARL reference helps identify combinations that exceed the acceptable level.
-
Scatter Plot: is displayed when the main dimension is calculated from two dimensions. Each grouping is represented by a bubble positioned according to the values obtained in both dimensions. The side panel allows you to search and select groupings to locate them on the chart.
Interactive charts
The charts allow you to select bars, segments, cells, or groupings to filter the information displayed in the other charts and in the tree.
Only one active selection can be maintained. Selecting another item replaces the previous selection; clicking again on the selected item removes the filter. This selection is not displayed in the filter bar, and Clear Filters does not remove it.
Chart options
Each chart has a menu with the following options:
-
View in Full Screen: enlarges the chart for easier viewing.
-
Download Image: allows you to download it in PNG, JPEG, PDF, or SVG format.
-
Print Chart: opens the print options.
Grouping and Risk Tree
Below the charts, each grouping is displayed with the risks associated with each. The same risk associated with multiple groupings appears under each of them. The columns are as follows:
-
Grouping / Risk: displays the name of the grouping and, when expanded, the risks it contains.
-
Main Field and Configurable Fields: displays the risk methodology fields with the Show option active, in the order defined in the methodology.
-
Main Risk Dimension: in the grouping row, displays the risk level calculated using the analysis criterion; in each risk, its individual assessment.
-
Item: in the grouping row, displays the total risks it contains; in each risk, the item it is associated with.
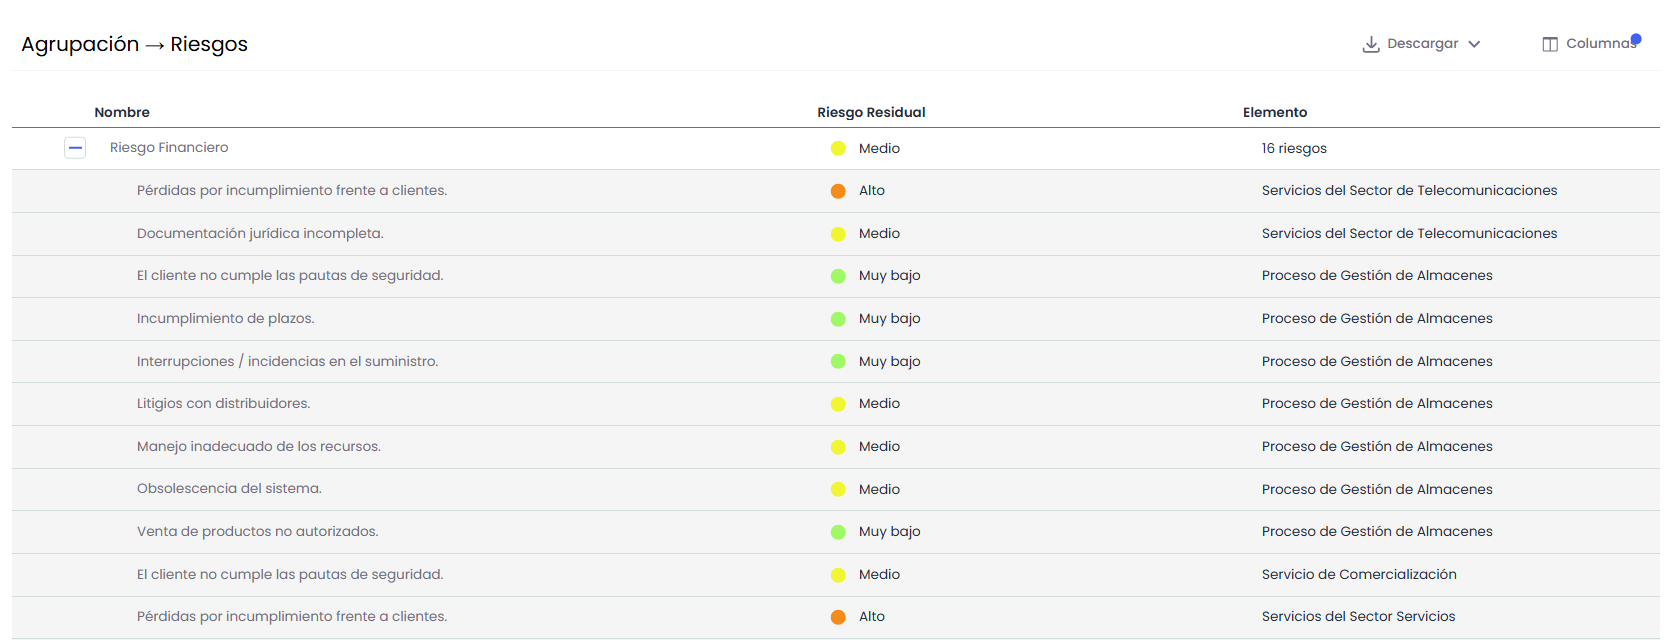
Table actions
-
Download: allows you to generate the available reports considering the applied filters and configuration.
-
Filters: allows you to narrow down the information displayed in the charts and the tree.
-
Columns: allows you to show, hide, and reorder the available columns, as well as add dimensions from the methodology. The Grouping / Risk column always remains visible.
Filters
The filter bar by default displays Grouping, Item, and Risk.
-
Grouping and Risk: allow multiple selection using a search tool and the options Contains and Does Not Contain.
-
Item: allows you to select the items from the analysis. When selecting one, the groupings containing risks associated with that item or its dependent items are displayed.
-
Configurable Fields and Dimensions: using +, you can add the visible fields from the methodology and their dimensions. Qualitative dimensions allow filtering by level, and quantitative ones by numerical value.
The different filters are applied cumulatively to the charts, the tree, and the reports. The Clear Filters option removes the filters applied from the bar.
Downloads
The Download option allows you to generate the following reports:
-
Risk Grouping Report: generates a CSV file with information about the groupings and associated risks, considering the visible columns, filters, and applied sorting.
-
Global Risk Report: generates an Excel file with consolidated values of the risk groupings. The values are calculated according to the criterion defined in Risk Calculation by Risk Grouping.
Overview of the Tab
Considerations
-
A risk associated with multiple groupings is counted in each of them. For this reason, the sum of risks across all groupings may exceed the total number of risks in the analysis.
-
If the Risk Calculation by Risk Grouping criterion is modified in General Information, the risk levels of the groupings are recalculated.
Related Resources
-
Risk Assessment: indicators and saved views.
-
Information and Items: calculation criterion by grouping, ARL, and TRL of the analysis.
-
Risk Methodology: main dimension, levels, and configurable fields.