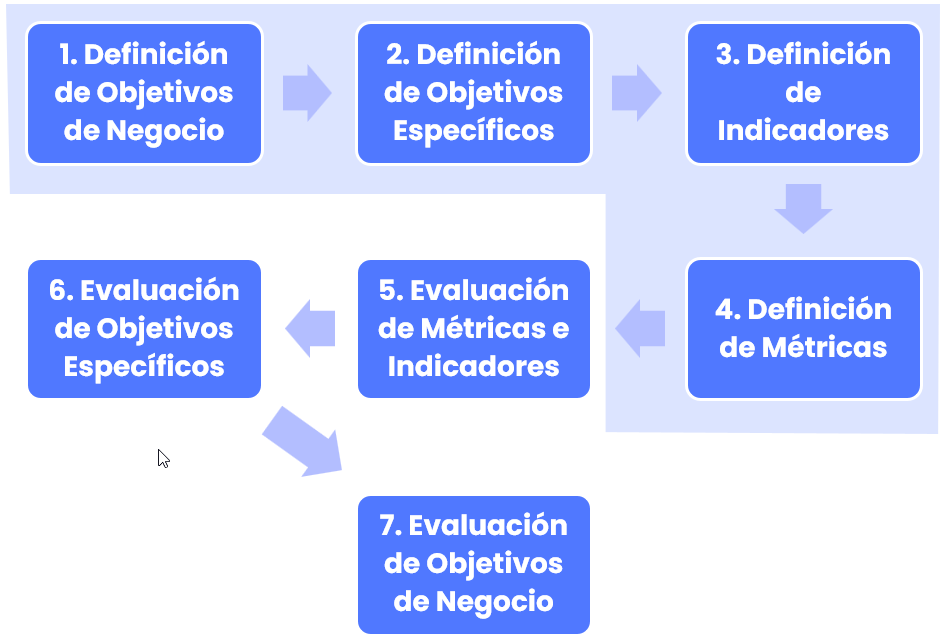
In this article, we address how to configure the GlobalSuite® balanced scorecard, defining business and specific objectives, indicators, and metrics, and how to evaluate their compliance through graphs, periodic evaluations, and the strategic map to analyze organizational performance.
Definition of ScoreCard
The ScoreCard or Balanced Scorecard option provided by GlobalSuite® allows the calculation, control, and representation of indicators that help define and monitor objectives, as well as evaluate the performance of the implemented management systems.
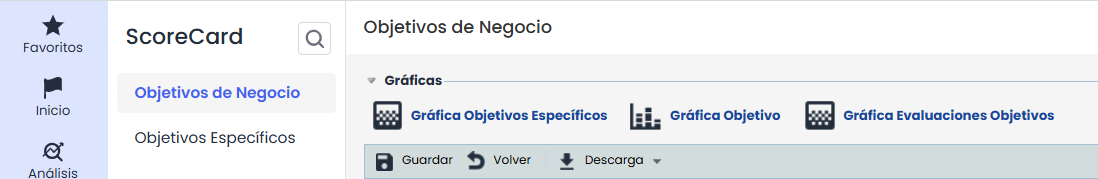
Within the “ ScoreCard” tab of GlobalSuite®, we have the options of “ Business Objectives ” and “ Specific Objectives ”, for defining, consulting, and monitoring the goals proposed by the entity at various organizational levels.
For monitoring and evaluating the proposed objectives, GlobalSuite® allows, through the tabs “Indicators” and “Metrics”, associating measures and controls to verify if the actions taken bring the organization closer to its objectives.
For the complete evaluation of the objectives, GlobalSuite® provides in the “All Indicators” option a graphical representation of the previously defined indicators, thus providing a quick and intuitive analysis of the organization's progress concerning the planned goals.
Finally, the “Strategic Map” option allows identifying the different correlations between the defined Specific Objectives, as well as visualizing the status of each objective.
Definition of Business Objectives
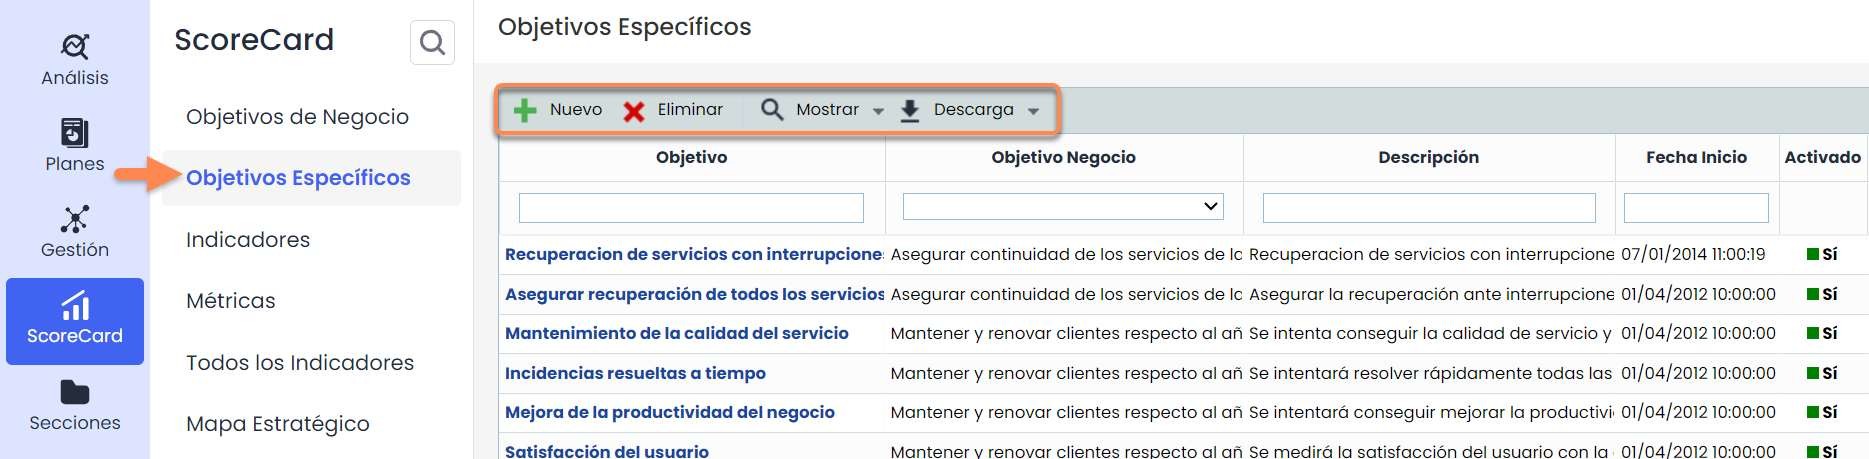
To start defining the objectives, you must select the “ Business Objectives ” option within the “ ScoreCard ” section. Upon accessing the “ Business Objectives ” option, the entity's general objectives appear.
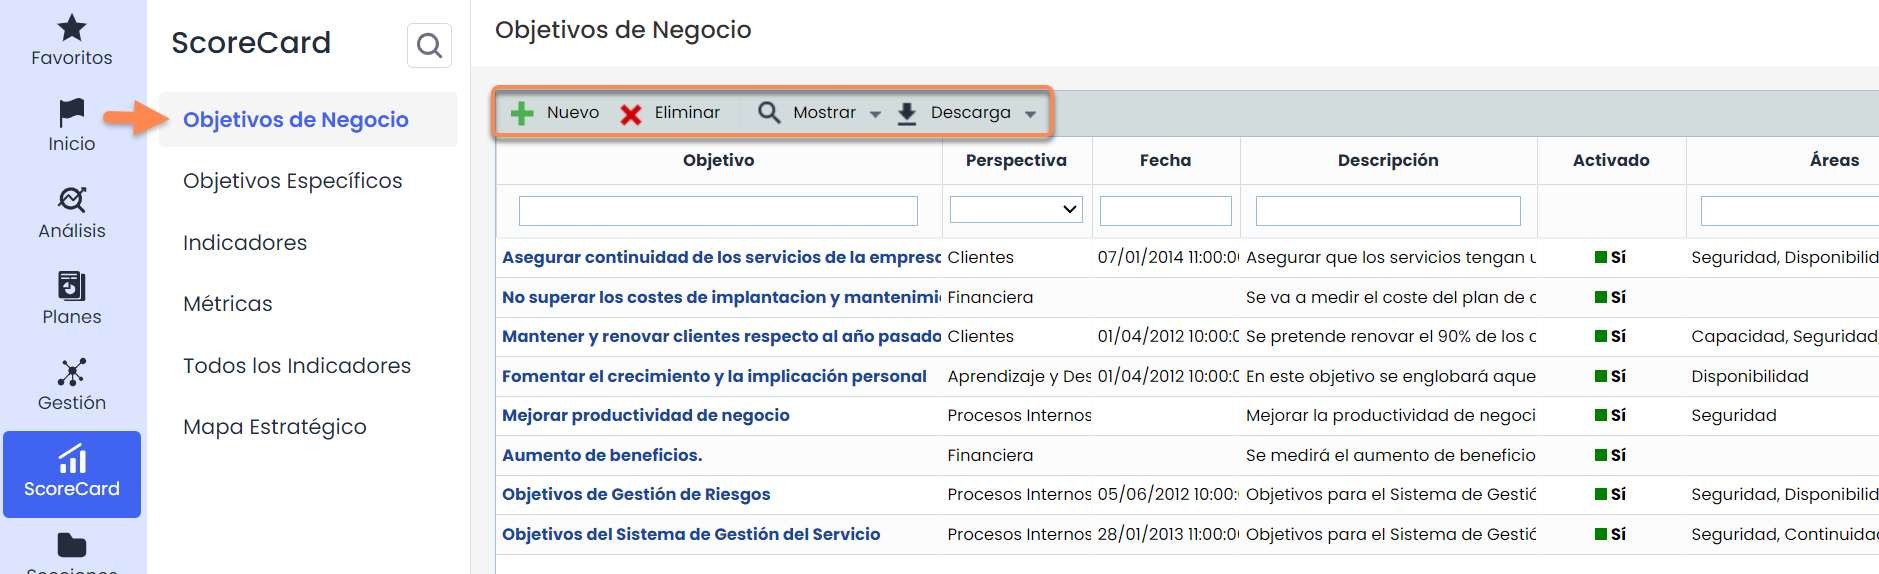
As part of the main screen, GlobalSuite® allows executing the following actions:
-
New: Allows generating new Business Objectives.
-
Delete: Allows deleting existing Business Objectives.
-
Show: Allows visualizing only the activated objectives or all of them.
-
Download: Allows downloading the list of Business Objectives in different formats.
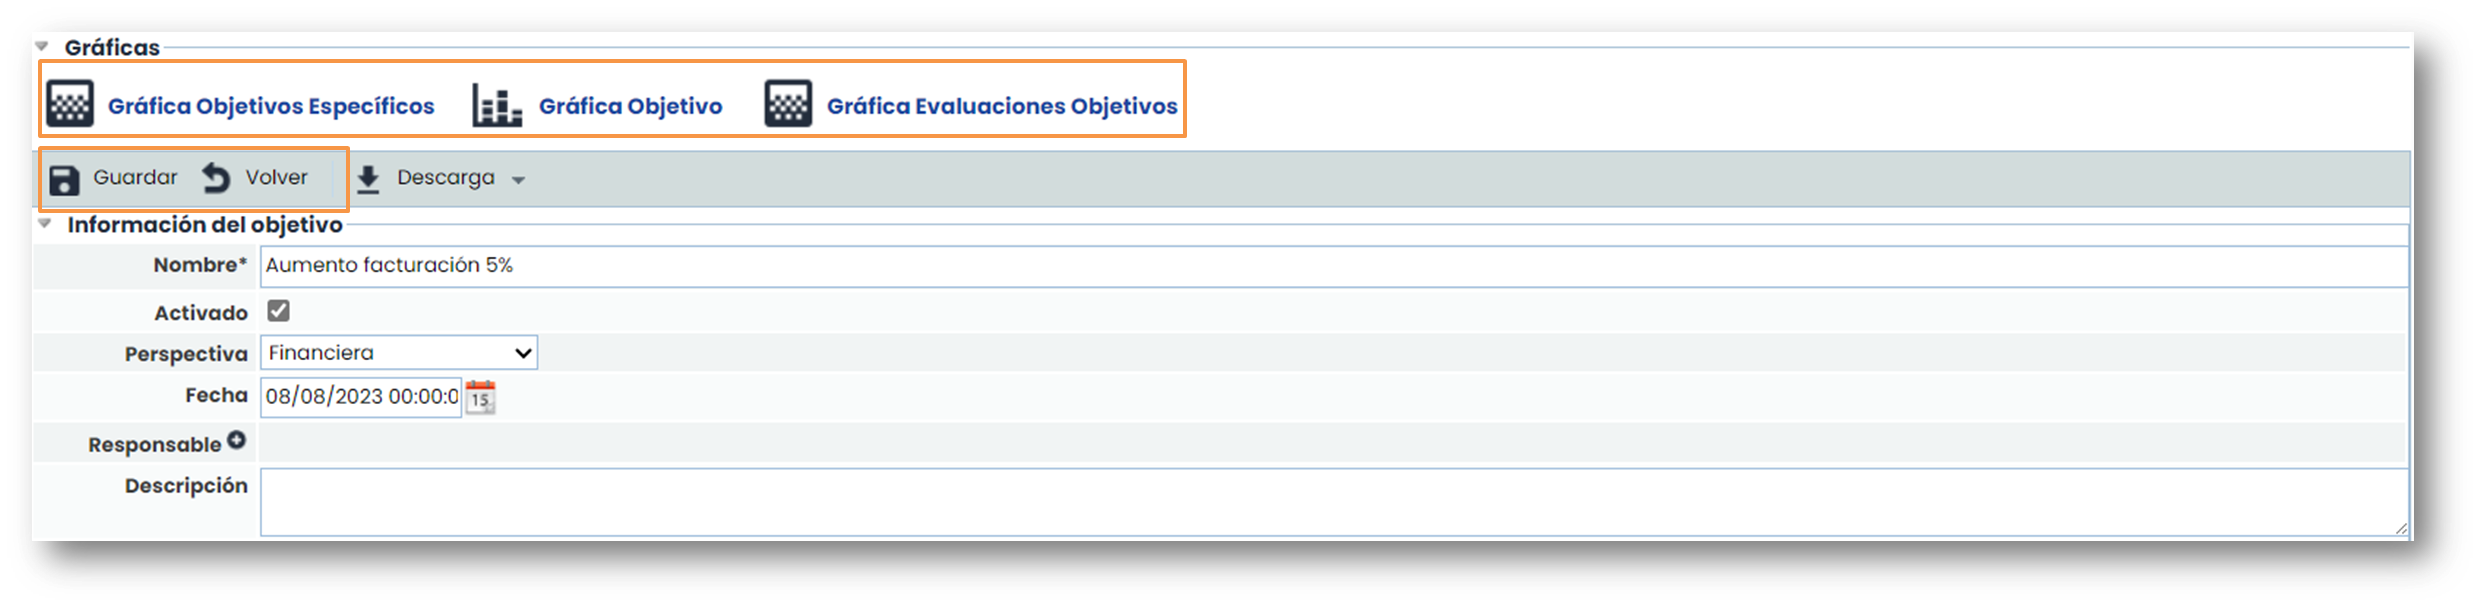
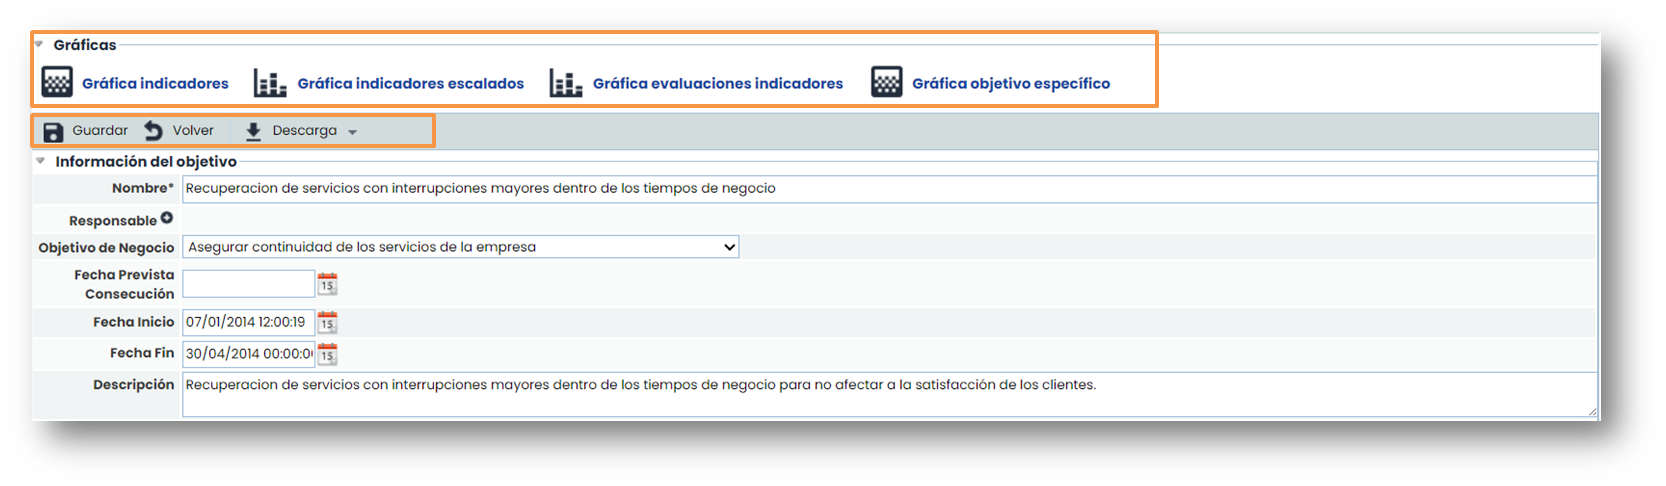
Once a new business objective has been created using the “ New” button, clicking on the link associated with the objective's name opens a form where information related to the objective can be registered. The objectives screen is divided into three parts:
-
Graphs: Representation of the performance of Business Objectives through the association of Specific Objectives.
-
Objective Information: General description of the objective, associated services and areas, related Specific Objectives, etc.
-
Evaluation: Where periodic evaluations of the Business Objectives are described.
Once the information has been registered, it is necessary to click on the “ Save” button to store the changes. To return to the list, you must click on the “ Back” button.
Definition of Specific Objectives
In the “ Specific Objectives ” option, concrete goals are created whose achievement ensures the success of the related business objective. By clicking on the objective's name, we access the form that allows detailing, graphically representing, and updating its monitoring through indicators and periodic evaluations.
The GlobalSuite® options allow executing the following actions:
-
New: Allows generating new Specific Objectives.
-
Delete: Allows deleting previously created Specific Objectives.
-
Show: Allows visualizing only the activated objectives or all of them.
-
Download: Allows downloading the list of Specific Objectives in different formats.
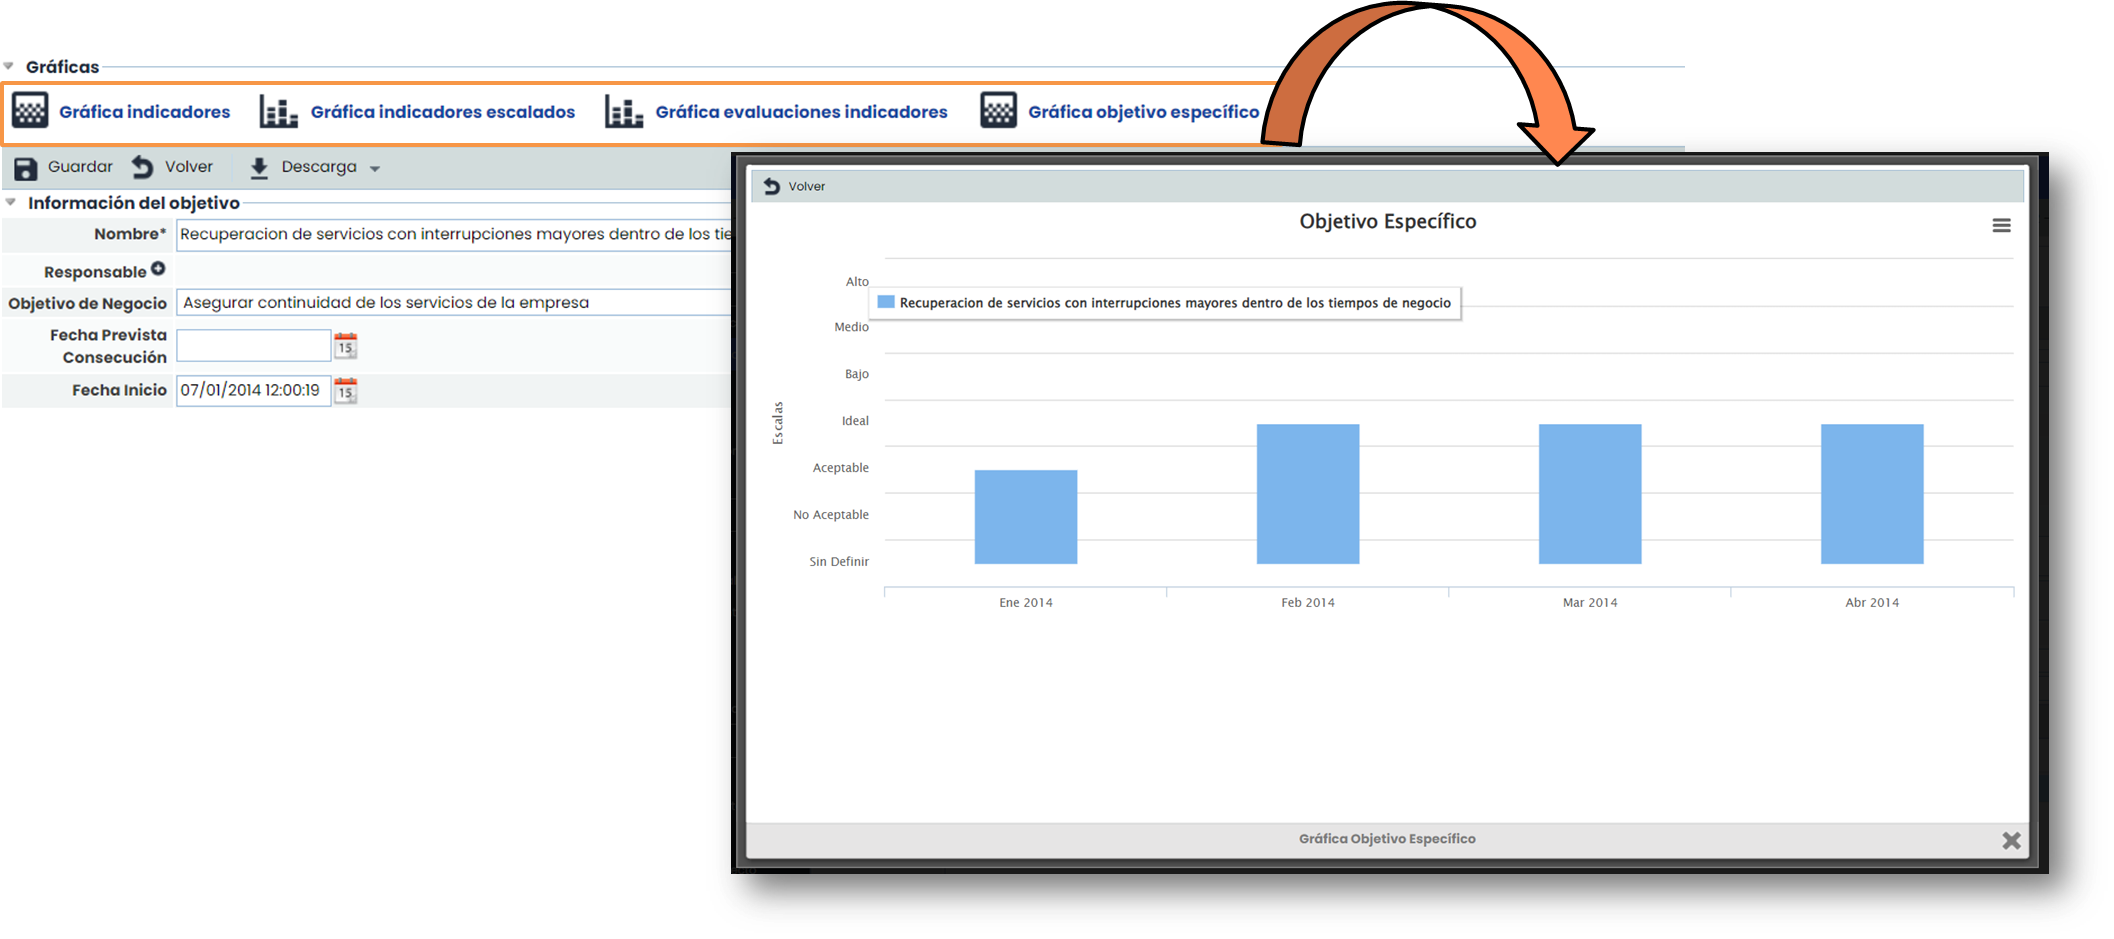
By clicking on the objectives, you access the GlobalSuite® screen that allows the detailed registration of specific objectives. The registration consists of five sections:
-
Graphs: Representation of the performance of Specific Objectives through the association of Indicators.
-
Objective Information: General description of the objective, associated services and areas, related Business Objectives, etc.
-
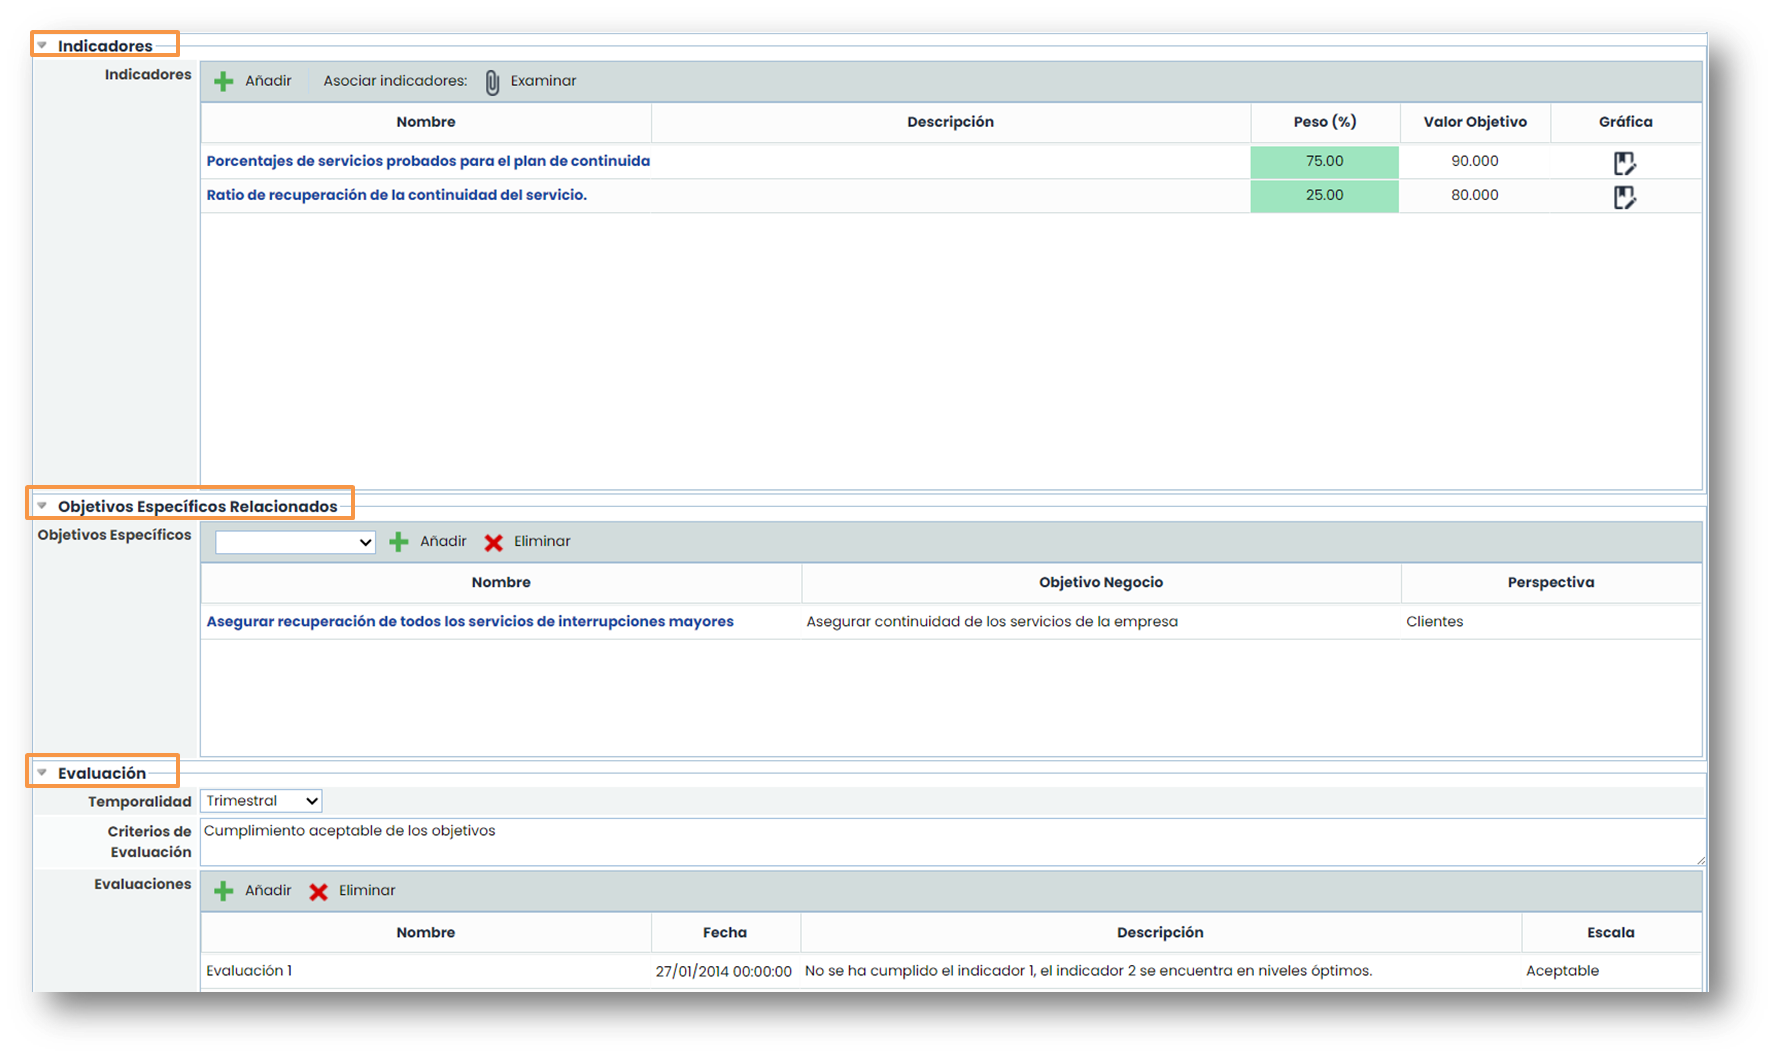
Indicators: To quantify the progress in meeting the objectives, these parameters can be created and associated with the entity's Specific Objectives.
-
Related Specific Objectives: Other associated specific objectives.
-
Evaluation: Where periodic evaluations of the Specific Objectives are described.
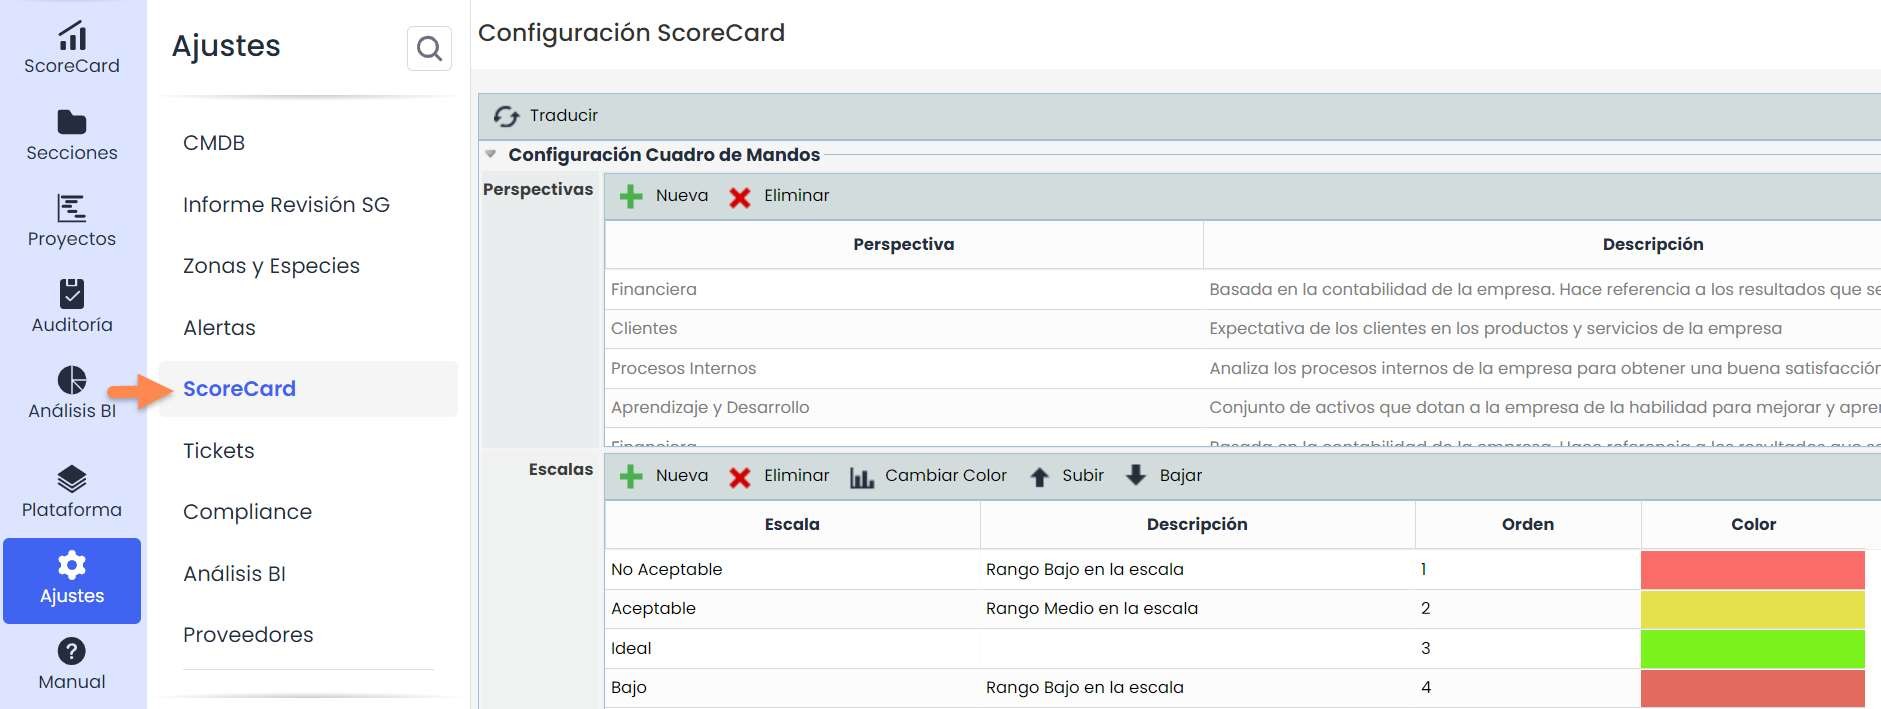
ScoreCard Configuration
This ScoreCard option is located in Settings > ScoreCard Configuration.
Here, you can configure the different perspective options that appear in the business objectives.
Additionally, you can also configure the scales for evaluating the different objectives.
Definition of Indicators
The third option of the Balanced Scorecard allows defining “ Indicators ” to assess the progress and degree of compliance of the related Specific Objectives, as well as the status and trend of the defined Indicators.
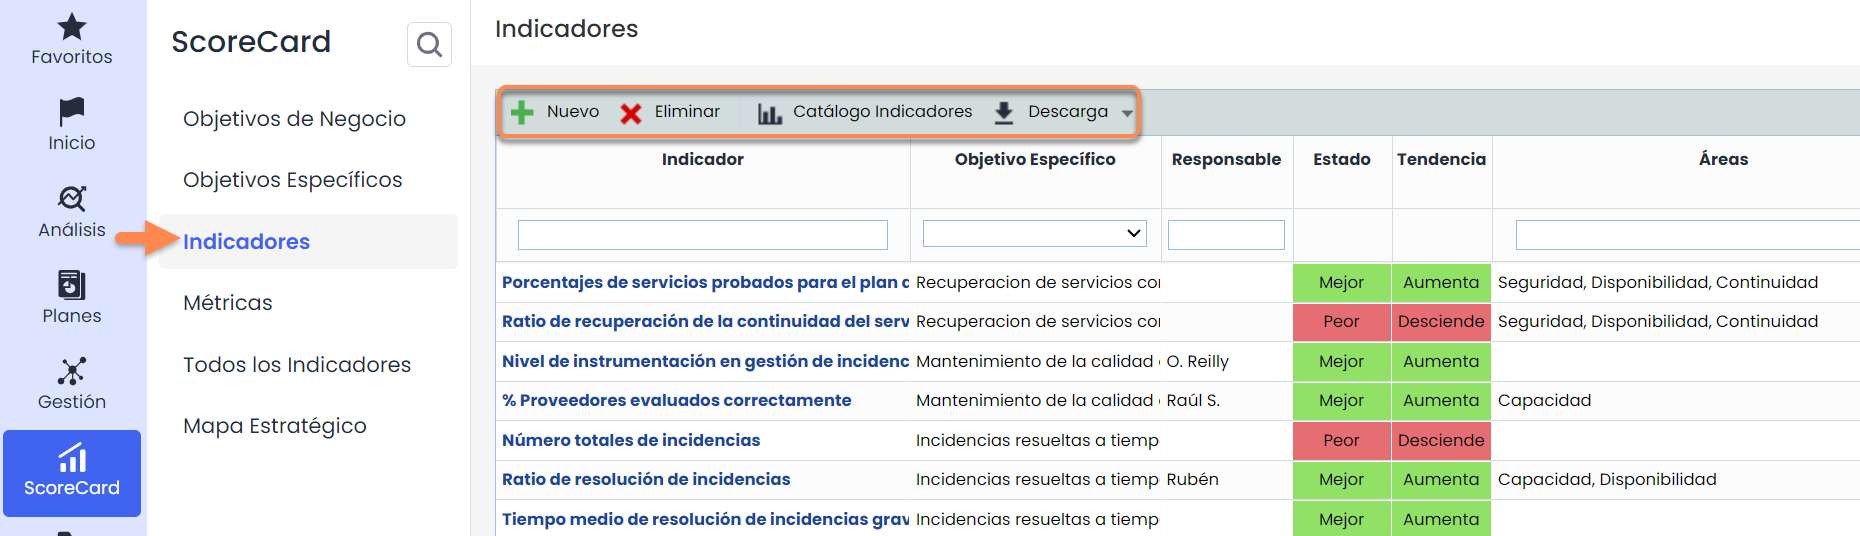
The options provided by the GlobalSuite® tool regarding Indicators are:
-
New: Allows generating new indicators.
-
Delete: Allows deleting indicators.
-
Indicator Catalog: List of common indicators distributed by categories.
-
Download: Allows downloading a list of indicators in different formats.
There are 2 types of indicators:
-
Manuals. Consists of creating an indicator, where, depending on the chosen frequency, values must be manually added to the graphs of the metrics corresponding to the indicator's formula.
-
From the catalog. These are default indicators. In the “ Indicator Catalog” button, the available ones can be found. The advantage is that by choosing an indicator from the catalog, metrics associated with that indicator are created, so they do not need to be created manually.
Note: To have data in an indicator, it is necessary to have a metric associated with it, and for this, it is mandatory that the metric and the indicator have the same frequency.
By clicking on one of the indicators, you access the GlobalSuite® screen that allows characterizing, representing, and evaluating the indicator.
Two clearly differentiated parts appear:
-
Graph and Measurement Management Table: Allows visualizing the indicator values over time. The values are automatic based on the metrics that are part of the indicator.
-
Modify the indicator:
-
Indicator data: Consists of a form where the main data of the indicator are described. These data include the option to edit the formula for calculating the indicator through metrics, the “weight” of the indicator within its Specific Objective, or the target value to be achieved, among other options.
-
Evaluation: Manages the calculation of automatic evaluations of the indicator.
-
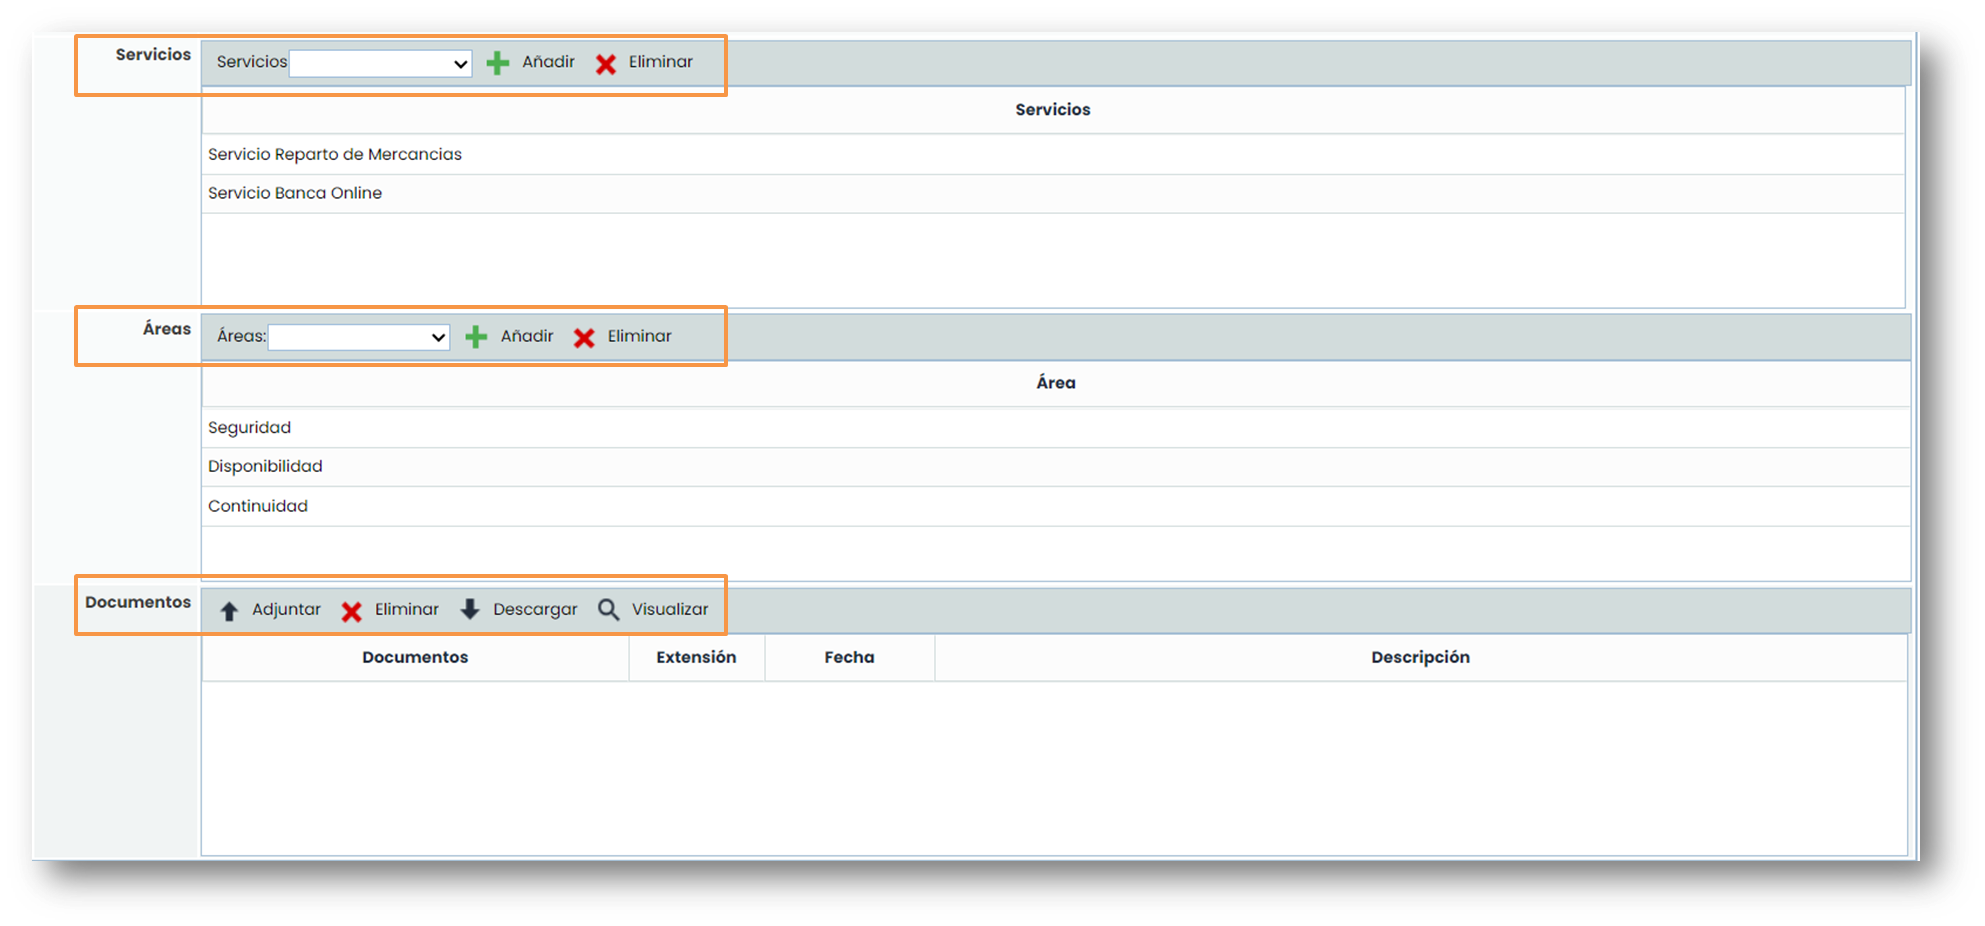
Each indicator can be associated with one or more services, one or more areas , and one or more documents that serve as evidence of the registered information.
To upload these documents, you must click on the “ Attach” button, and a pop-up window will open to select the documents to be attached that are on the local (on the computer). Additionally, a description can be added to each document.
Definition of Metrics
In the “ Metrics ” option, the measures and values used to define the indicators are defined. By clicking on the links of the metric names, options for defining and managing the metrics are accessed.
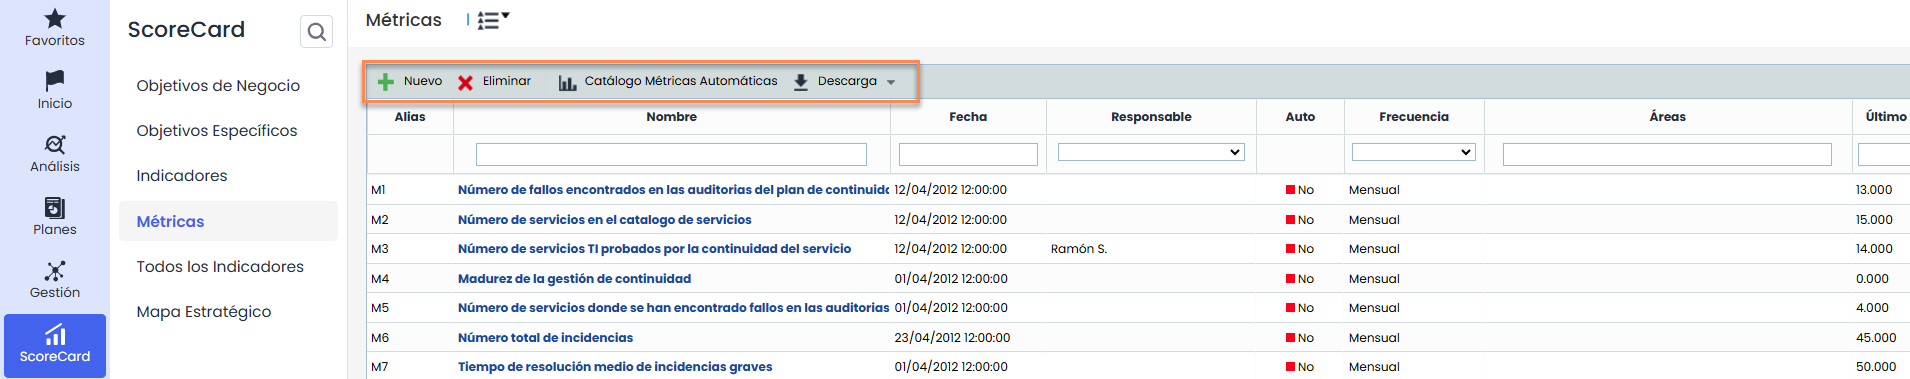
The options provided by the GlobalSuite® tool are:
-
New: Allows generating new Metrics.
-
Delete: Allows deleting Metrics.
-
Automatic Metrics Catalog: List of metrics, distributed by categories, that can be automatically obtained from information registered in GlobalSuite®.
-
Download: Allows downloading the list of Metrics in different formats.
There are 2 types of metrics:
-
Manuals. Consists of creating a metric, where, depending on the chosen frequency, values must be manually added.
-
Automatic. These are default metrics. In the “ Automatic Metrics Catalog” button, the available ones can be found. The advantage of these metrics is that they automatically collect data from GlobalSuite®, so they do not need to be entered manually.
By clicking on one of the created metrics or creating a “ New” one, you access the GlobalSuite® screen that allows characterizing and representing the metric. Two clearly differentiated parts appear:
-
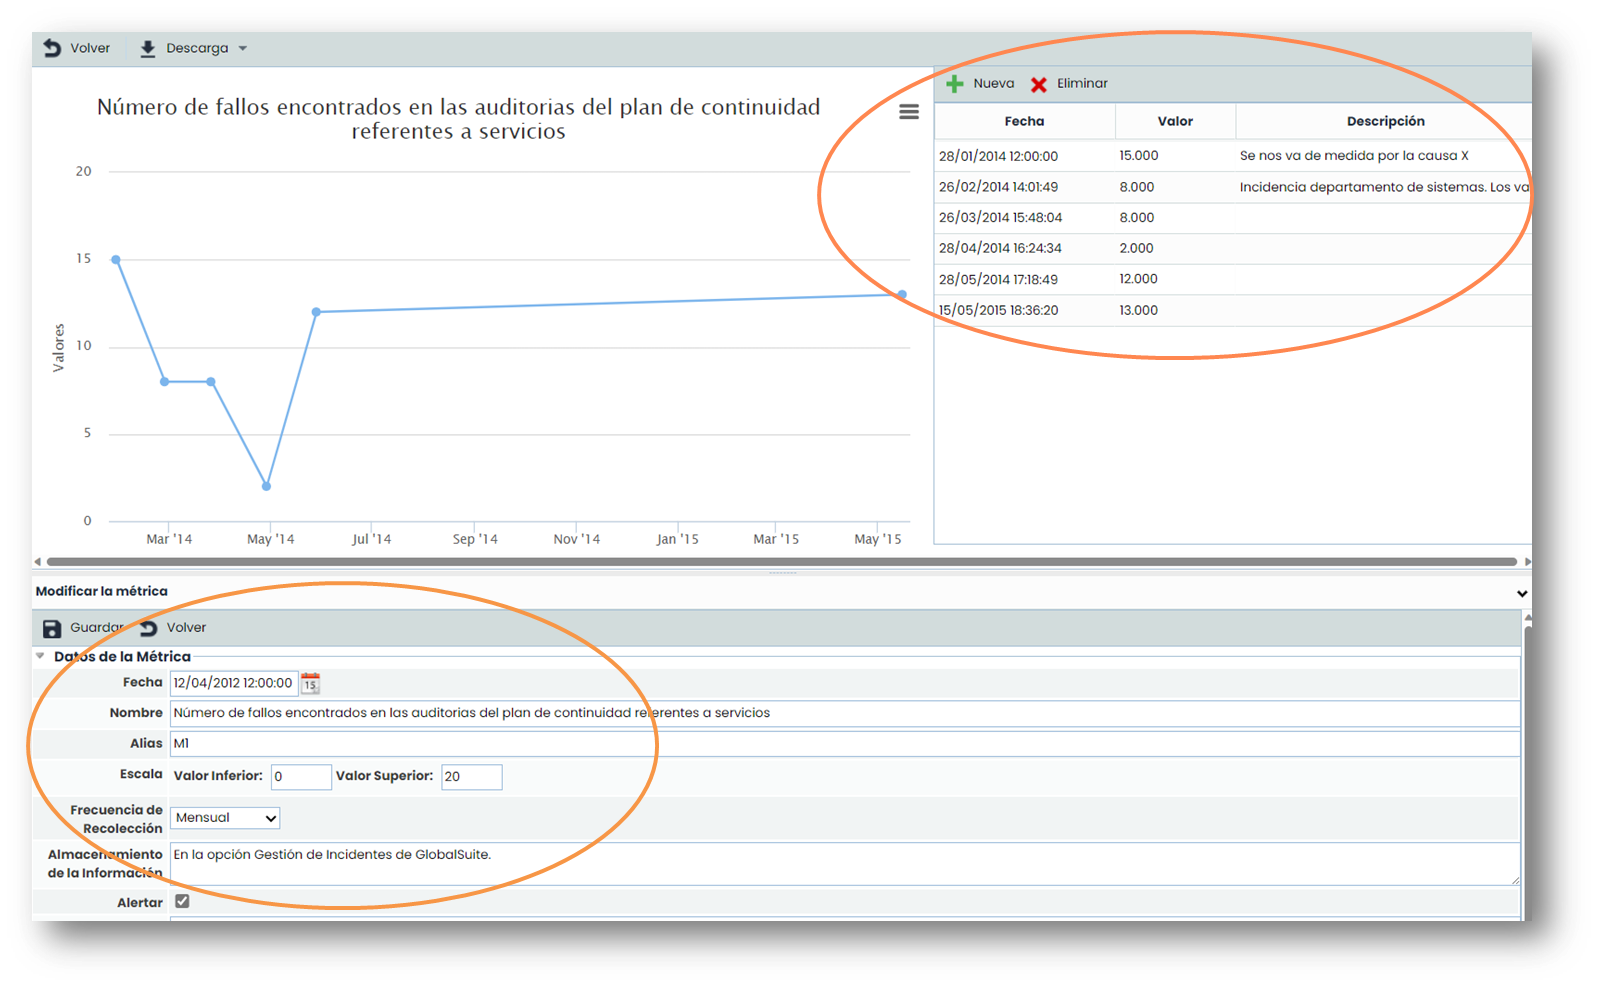
Graph and Measurement Management Table: Allows visualizing the metric values over time.
-
Modify the metric:
-
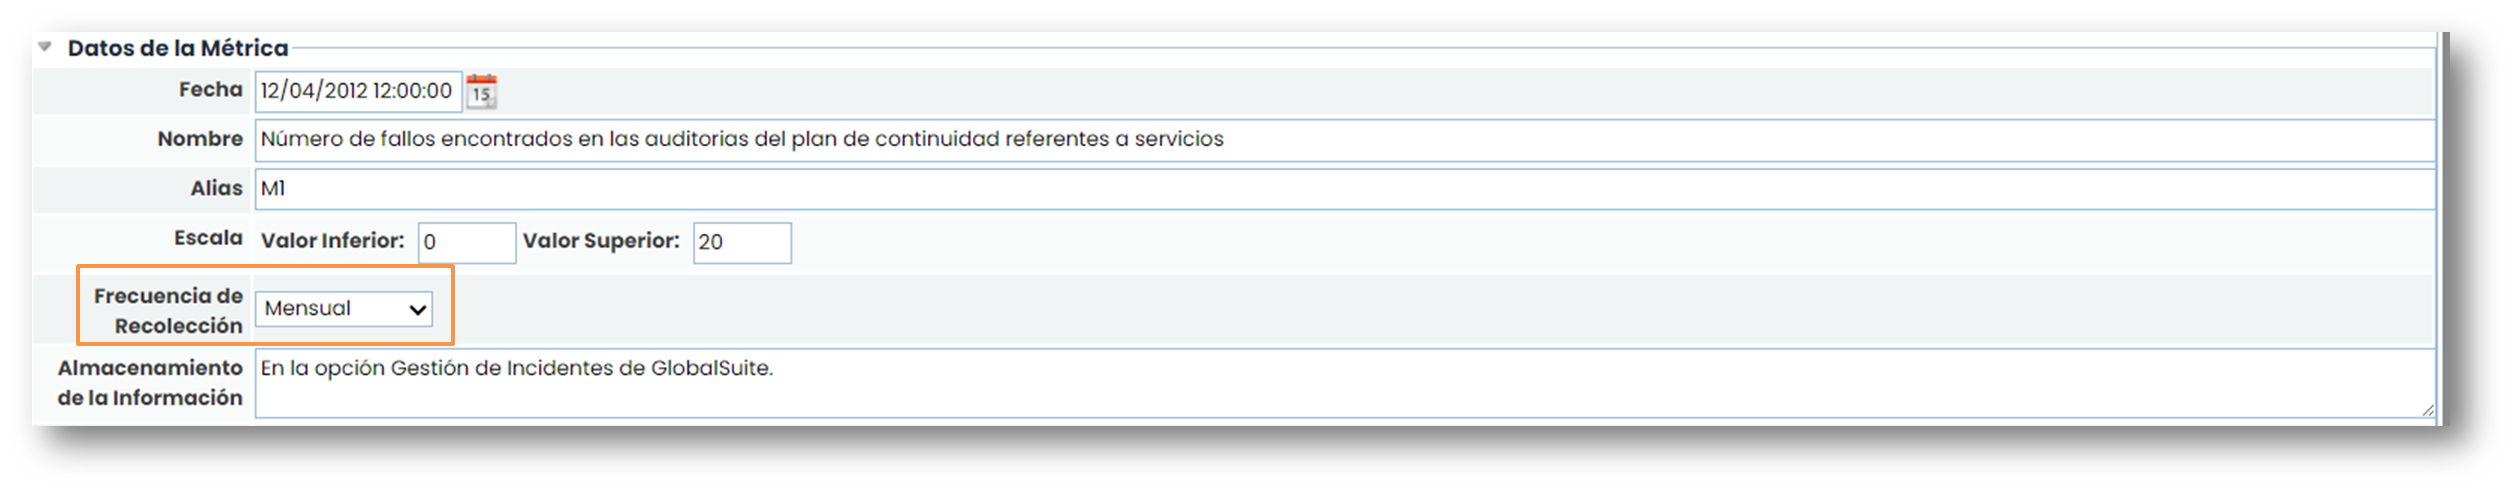
Metric data: Consists of a form where the date, name, frequency, among other available fields, appear. The alert checkbox allows notifying the metric's responsible parties that they must register a value.
-
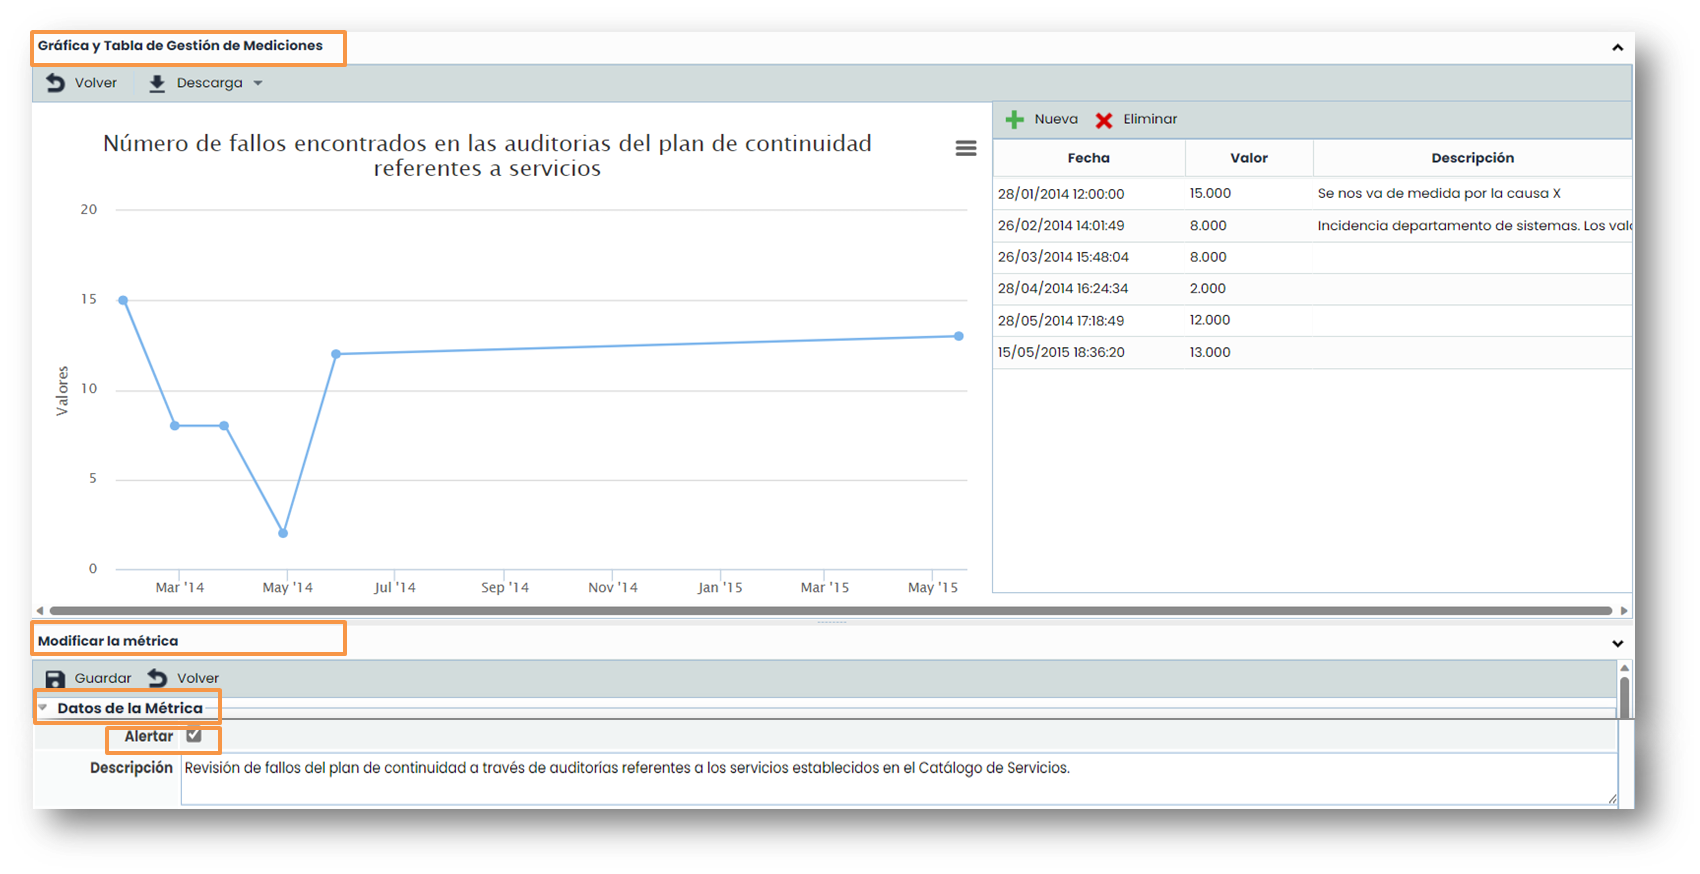
Once inside a metric, values can be assigned periodically. The metrics will be registered and represented in the Graph and Measurement Management Table. To assign a new value to a metric, you must click on the “ New” option. To delete a metric's data, click on the “ Delete” option.
To associate a metric with an indicator, the frequency of both must be the same.
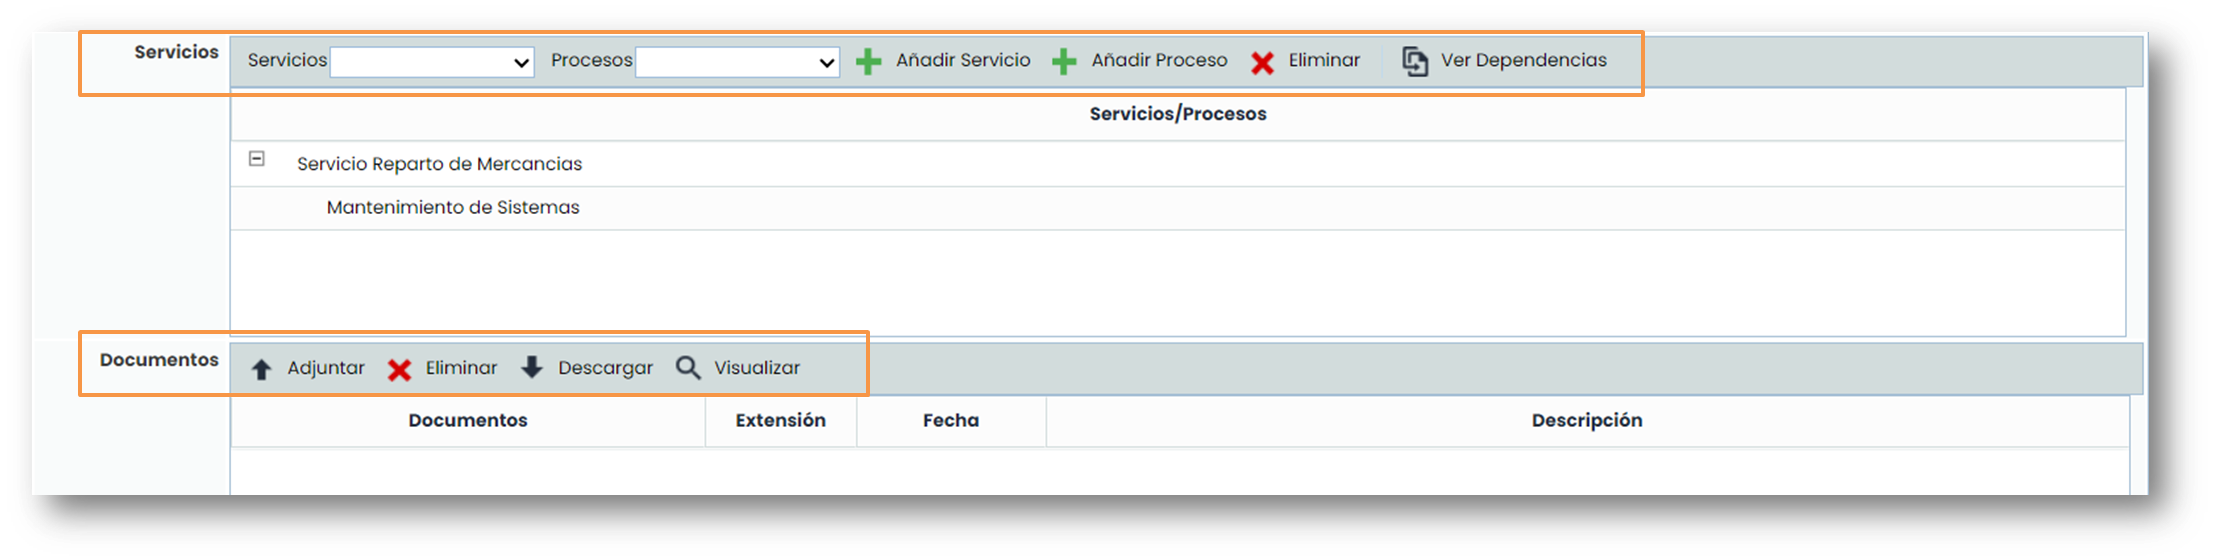
Each metric can be associated with one or more services, one or more processes associated with those services, one or more areas, and one or more documents that serve as evidence of the recorded information.
To associate a process, the service on which that process depends must first be added. Once added, the processes that depend on it can be added.
To upload these documents, click on the “Attach” button, and a pop-up window will open to select the documents you want to attach that are stored locally (on the computer). Additionally, a description can be added to each document.
ScoreCard Evaluation
Metrics Evaluation
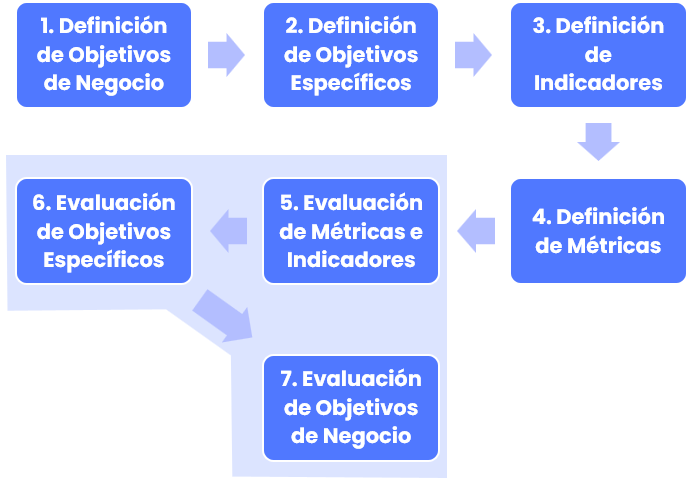
In the evaluation phase, the process followed is the reverse of the definition. The evaluation will be carried out from the most specific elements (“ Metrics”) to the most general ones (“ Business Objectives”).
The evaluation of metrics is performed by accessing the Metrics option and entering the evaluations of those metrics in the value table on the corresponding date.
Indicators Evaluation
For the evaluation of Indicators and Objectives, the process is carried out in reverse to their definition, interacting with the tool by ascending in the scorecard through the options “ Indicators”, “ Specific Objectives” and “ Business Objectives”.
When accessing a specific indicator from the “ Indicators” option, the values of that indicator can be calculated using mathematical formulas, whose variables will be the metrics defined earlier. Then, the indicator is evaluated in the Evaluations section, allowing the automatic representation of the indicator by clicking on Recalculate. The indicator will display as many data points as the associated Metrics in the formula have measurements.
Note: The periodicity between related metrics and indicators must be the same.
Specific Objectives Evaluation
Once the indicators are calculated, when accessing a Specific Objective, the graphs of the indicators and Specific Objectives can be viewed.
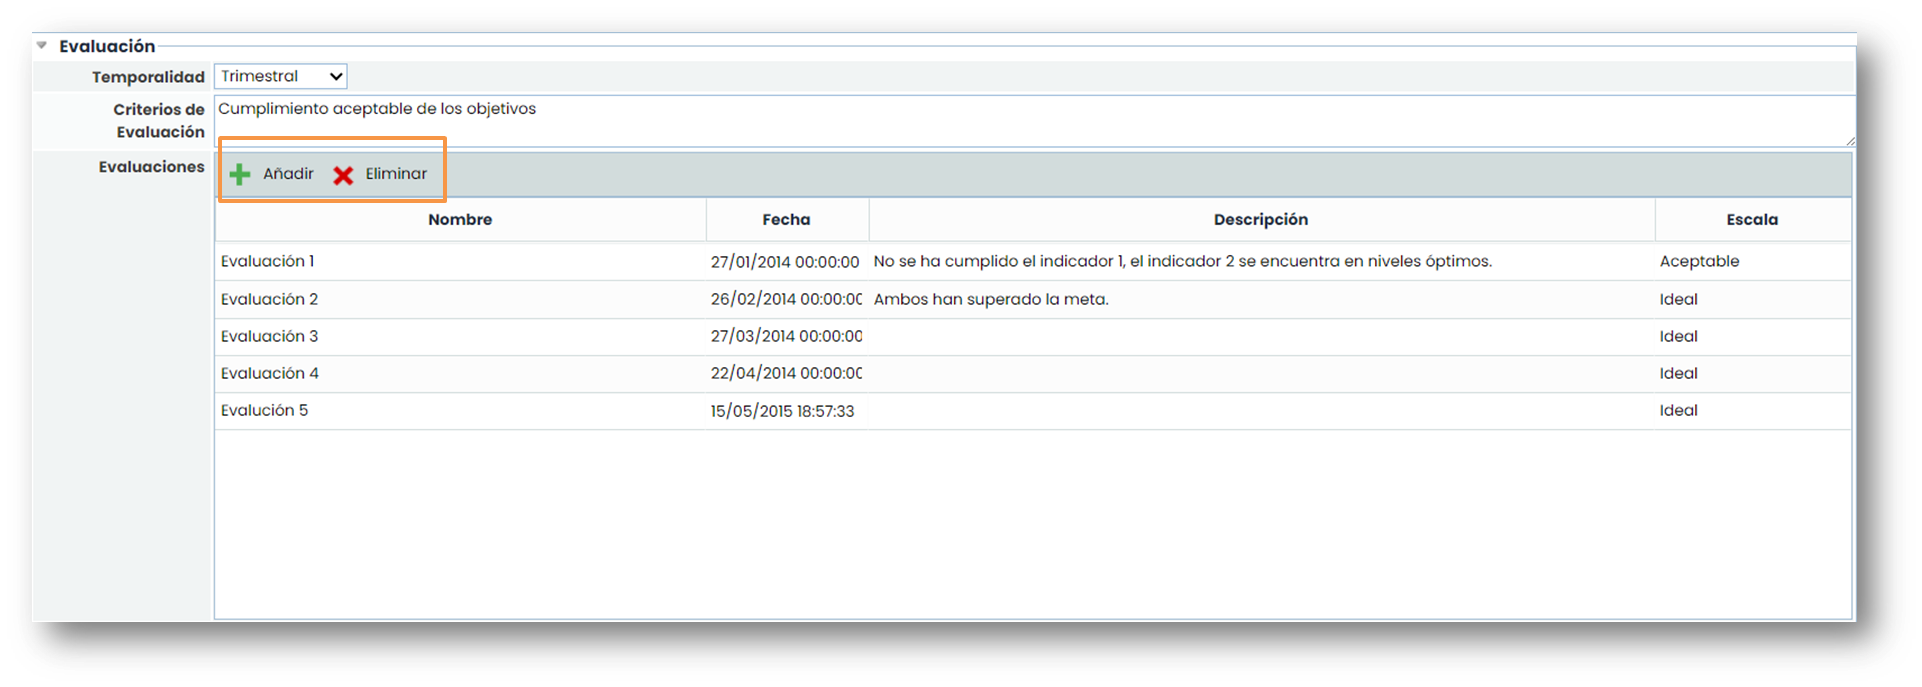
The evaluations of Specific Objectives allow recording the compliance evaluations performed on the defined specific objective as well as its periodicity. The options available are:
-
Add: Allows creating a new evaluation record.
-
Delete: Allows deleting a previously generated evaluation record.
Once the resulting graphs of the objective are reviewed, the Evaluations table must be filled in with the obtained data.
Note: The temporality of the Specific Objectives and related Indicators must be the same.
Business Objectives Evaluation
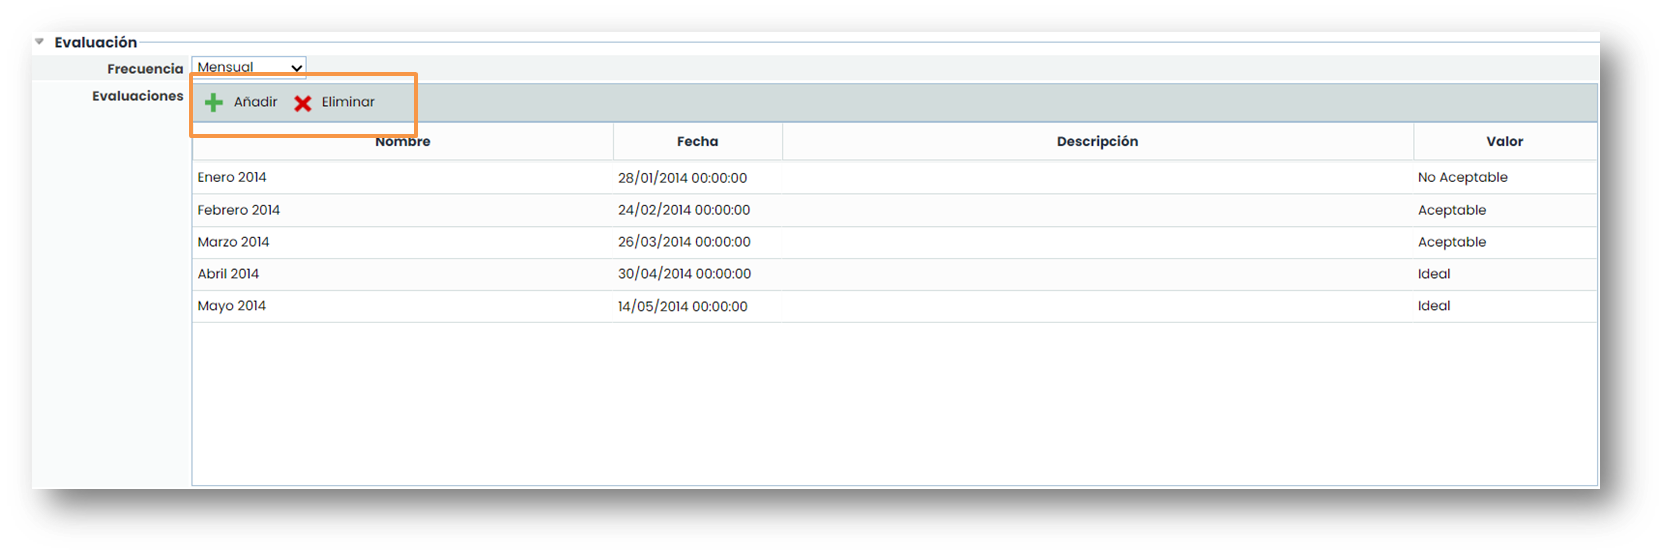
Once the evaluation table of Specific Objectives has been filled in, the graphs with the results of the Business Objectives can be viewed.
Finally, as with the Specific Objectives, GlobalSuite® allows evaluating the defined Business Objectives, specifying the frequency of the evaluations in the frequency section. Evaluations are created and deleted using the Add and Delete options.
Note: The frequency of business objectives and related specific objectives must be the same.
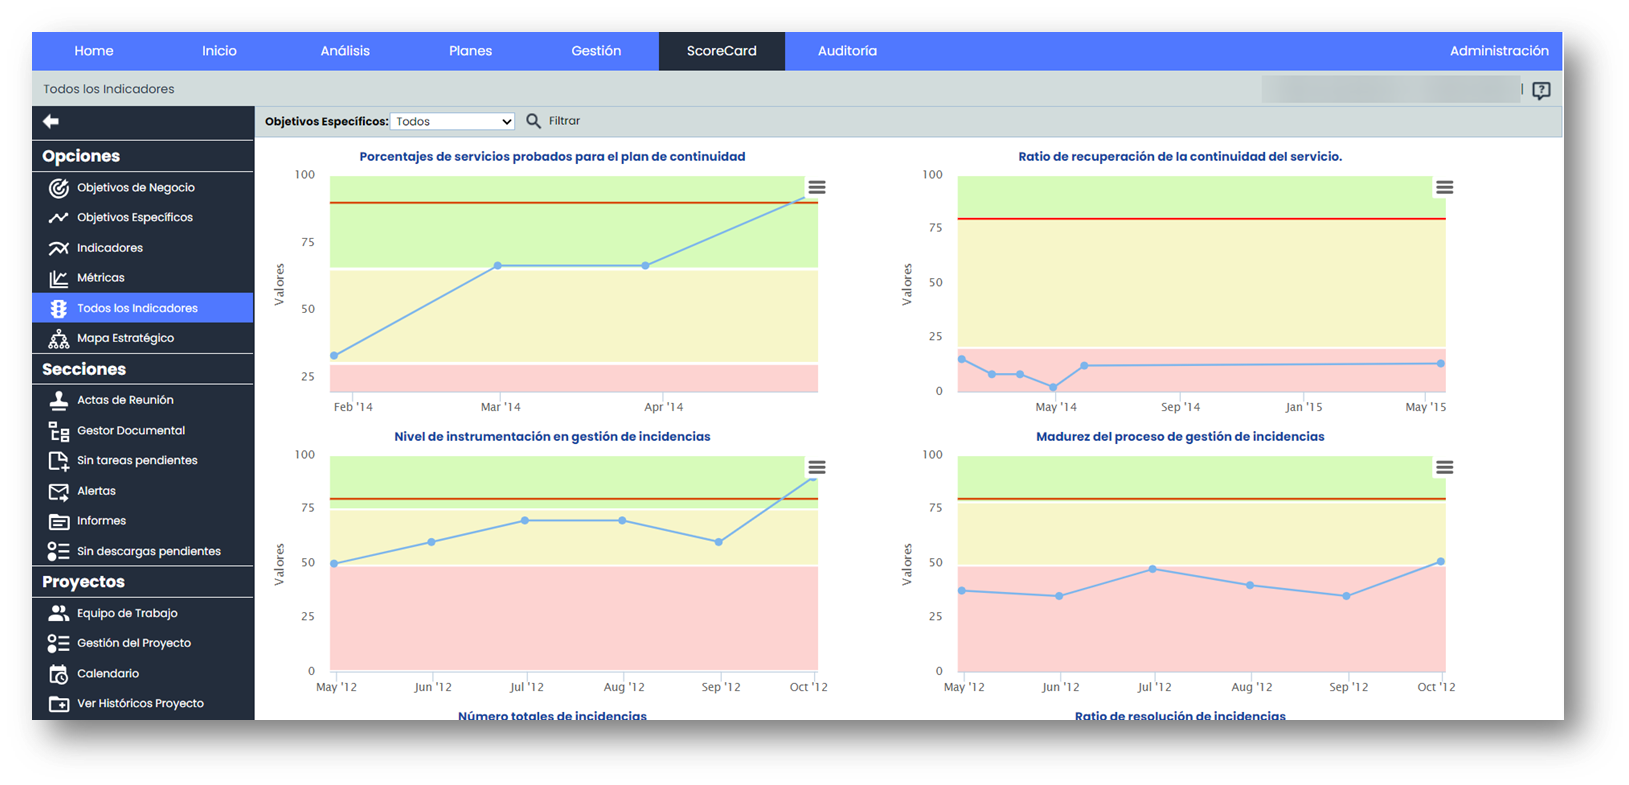
All Indicators
In the “ All Indicators ” option, all the indicators defined through the corresponding metrics are displayed. It is possible to filter by a specific objective to consult its indicators.
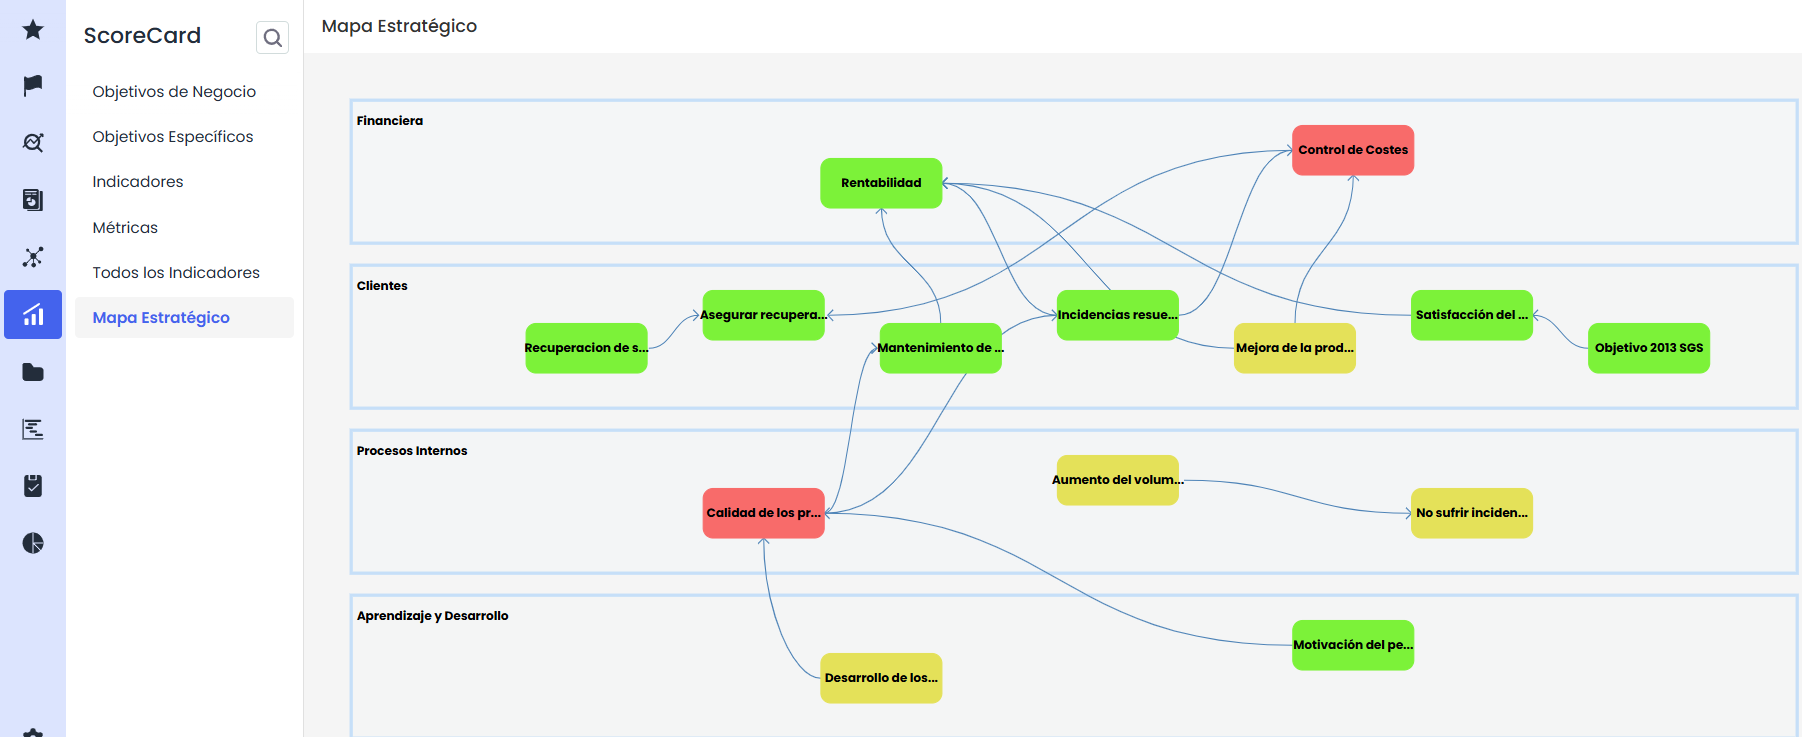
Strategic Map
This last option in the ScoreCard tab> Strategic Map allows us to visualize the relationships between the Specific Objectives based on the different perspectives of the Business Objectives. The color represents the state of the last evaluation performed on the Specific Objective.
Right-clicking on one of the objectives allows us to view the associated graphs.