The ScoreCard option provided by GlobalSuite® allows the calculation, control, and representation of indicators that help define and monitor objectives, as well as evaluate the performance of the implemented management systems.
Definition of ScoreCard (Dashboard)
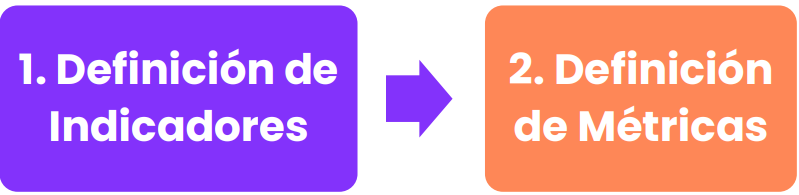
Within the “ScoreCard” tab of GlobalSuite®, we have the options of “Indicators” and “Metrics” for monitoring and evaluating the proposed objectives. Through these, GlobalSuite® allows associating measures and controls to verify if the actions taken bring the organization closer to its objectives.
Indicators
The first option of the Dashboard allows defining “ Indicators ” to assess the progress and degree of compliance with the KPIs, as well as the status and trend of the defined Indicators.
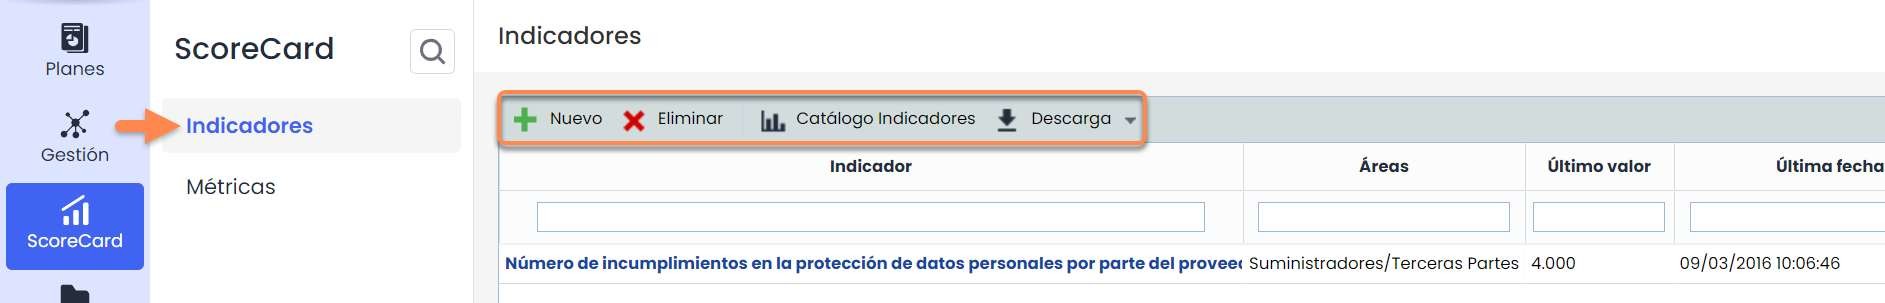
The options provided by the GlobalSuite® tool regarding Indicators are:
-
New: Allows generating new indicators.
-
Delete: Allows deleting selected indicators.
-
Indicator Catalog: List of common indicators distributed by categories.
-
Download: Allows downloading the list of indicators in different formats.
There are 2 types of indicators:
-
Manual: Consists of creating an indicator from scratch, where, depending on the chosen frequency, values must be manually added to the graphs of the metrics corresponding to the indicator's formula.
-
From the catalog. These are default indicators. In the “Indicator Catalog” button, the available ones can be found. The advantage is that by choosing an indicator from the catalog, metrics associated with that indicator are created, so they do not need to be created manually.
Note: To have data in an indicator, it is necessary to have a metric associated with it, and for this, it is mandatory that the metric and the indicator have the same frequency.
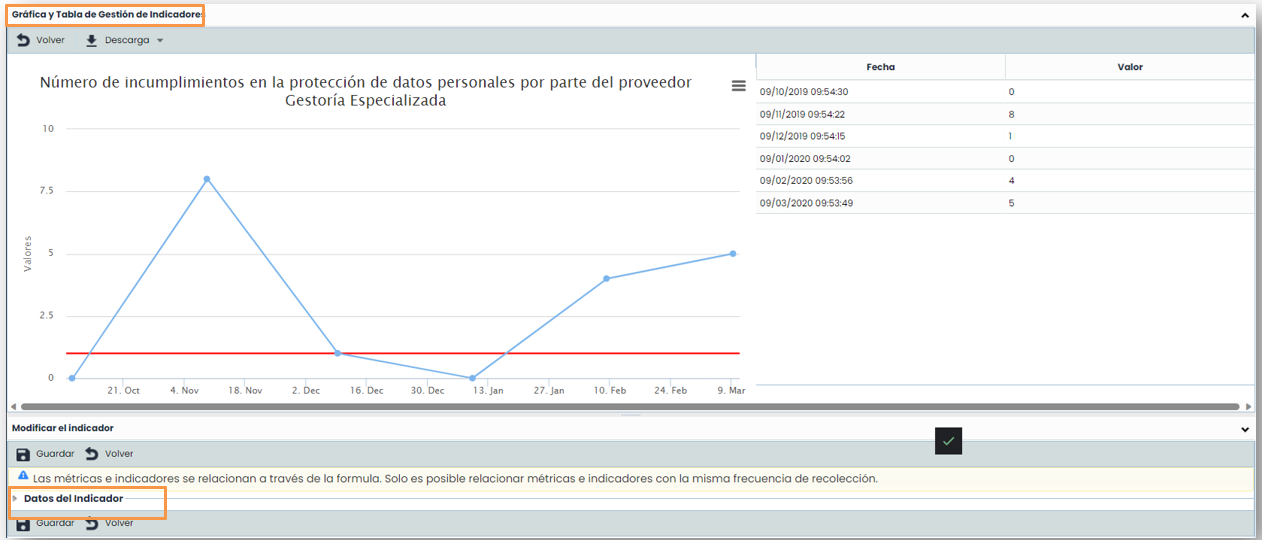
By clicking on one of the already created indicators or creating a “ New” one, you access the GlobalSuite® screen that allows characterizing, representing, and evaluating the indicator.
Two clearly differentiated parts appear:
-
Graph and Measurement Management Table: Allows visualizing the indicator values over time. These values cannot be modified from the indicators, as they are values provided by the associated metrics.
-
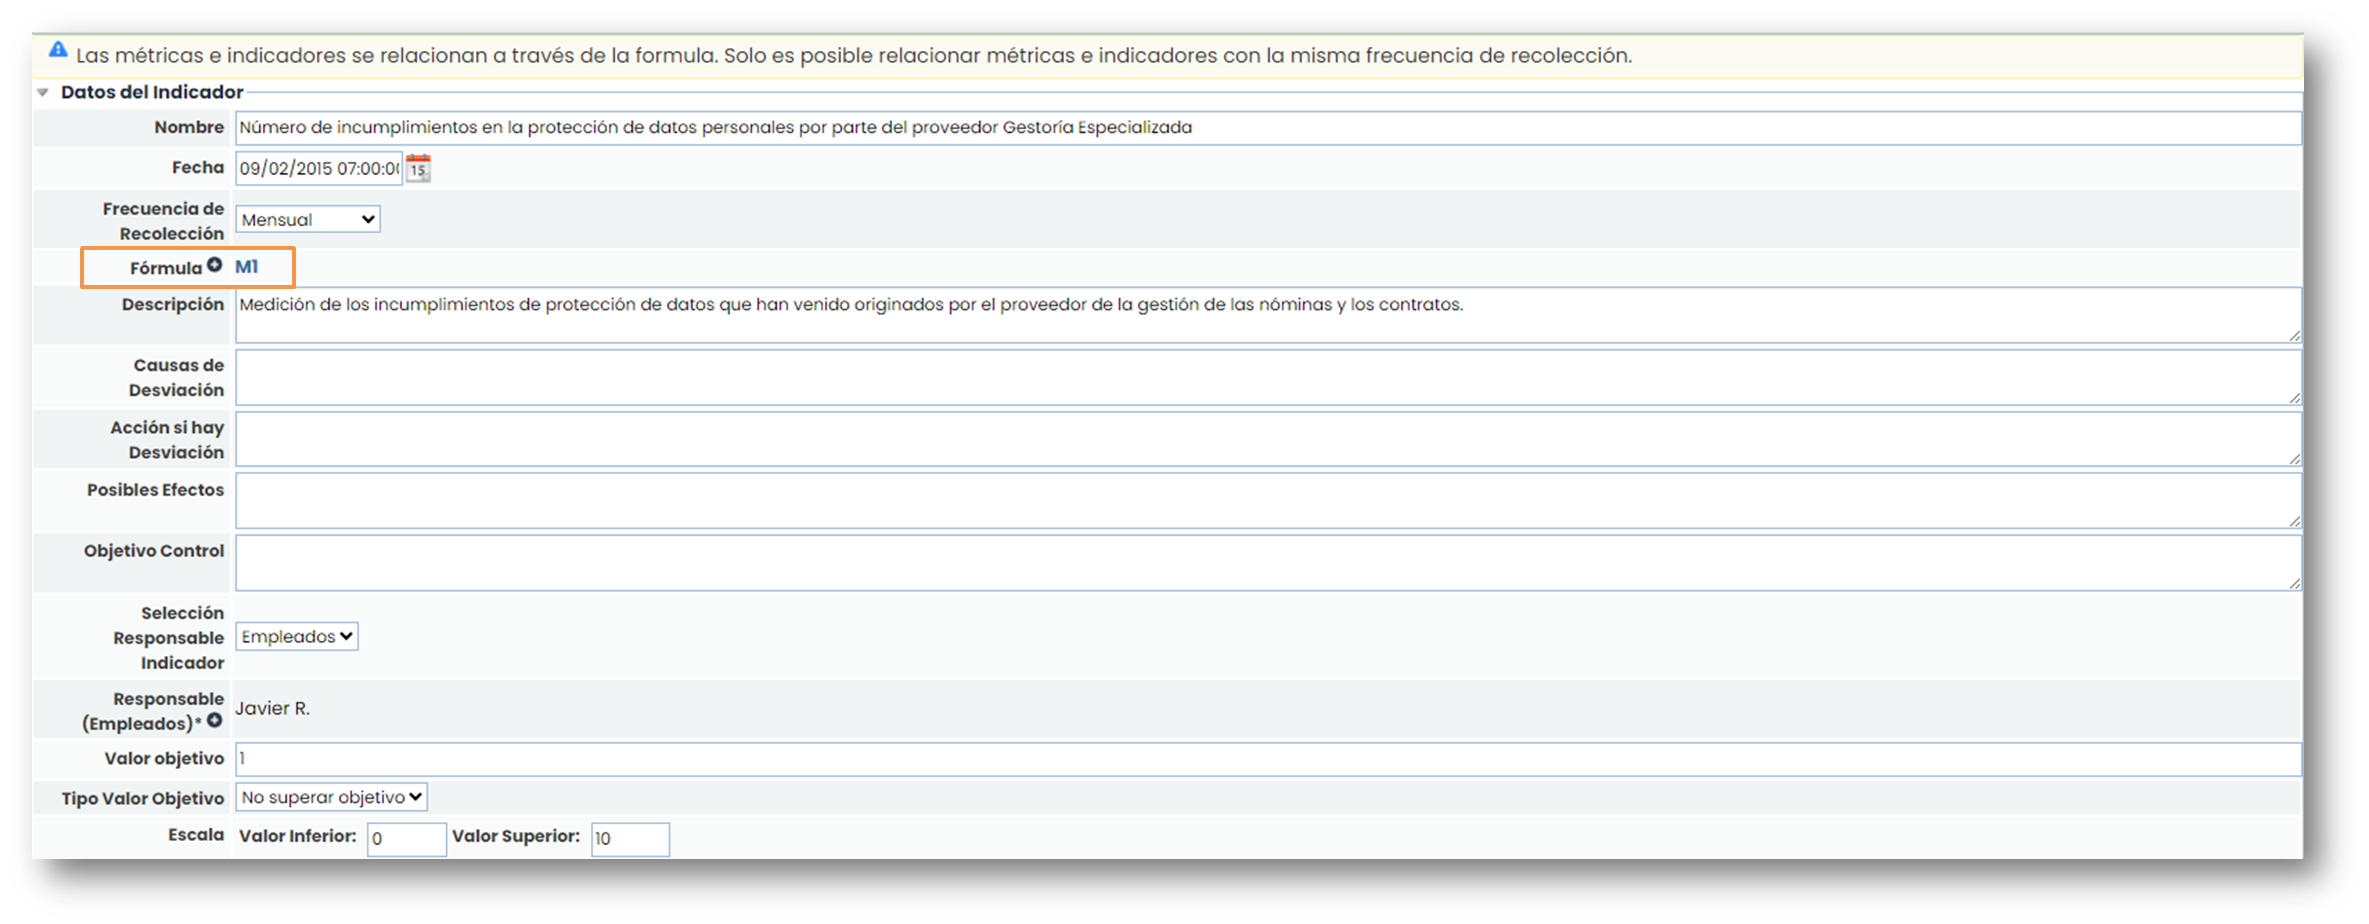
Modify the indicator:
-
Indicator data: Consists of a form where the main data of the indicator is described. This data includes the option to edit the formula for calculating the indicator through metrics, a description, a responsible person, a target value (value to be achieved), type of target value (what is to be achieved concerning the target value), among other options.
-
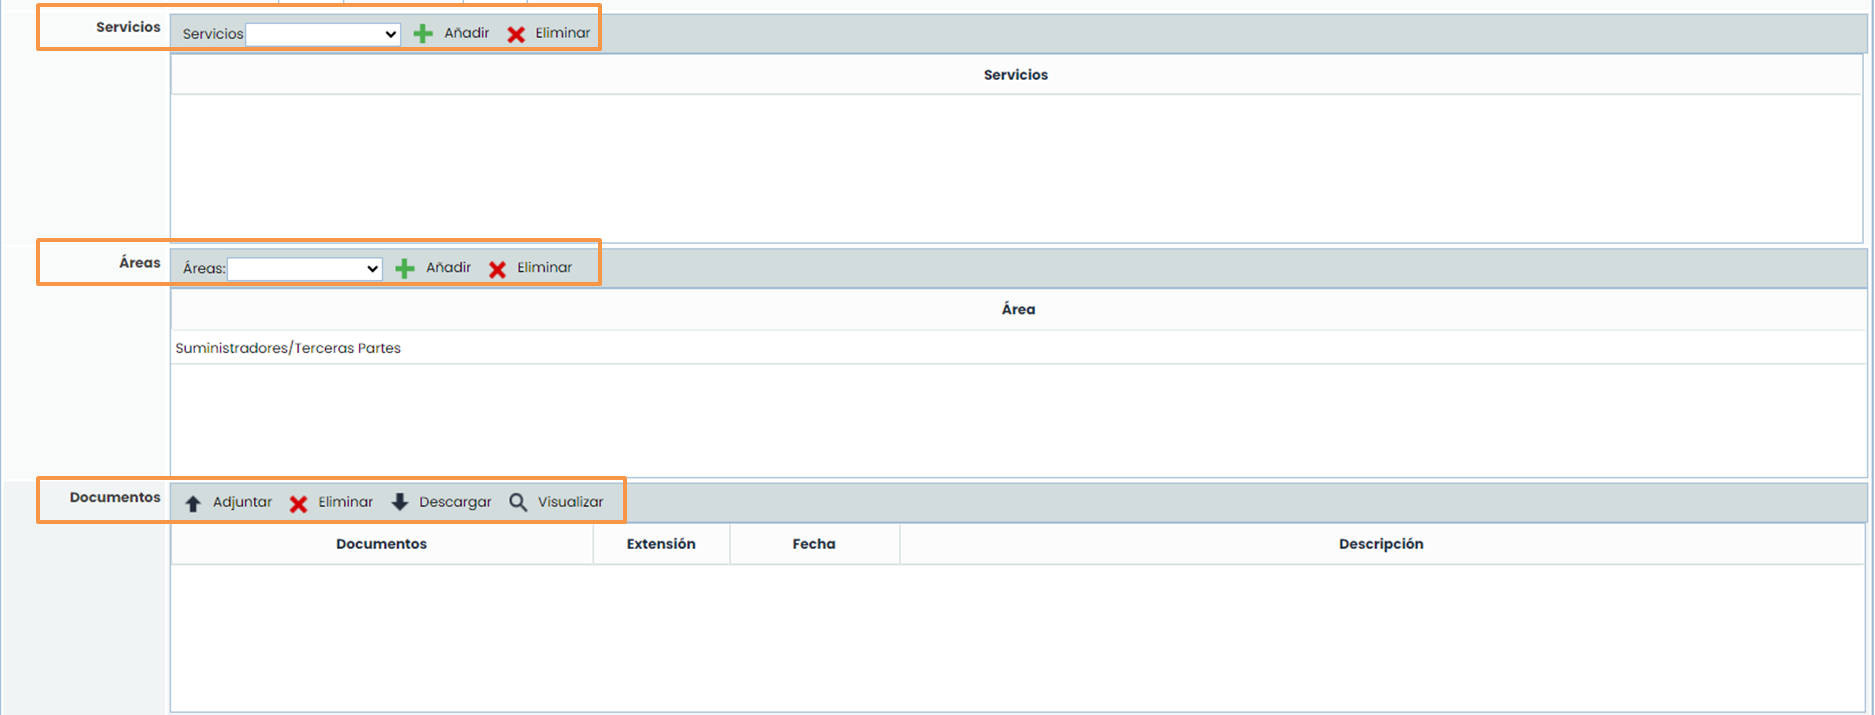
Each indicator can be associated with one or more services, one or more areas, and one or more documents that serve as evidence of the recorded information.
To upload these documents, click on the “ Attach” button, and a pop-up window will open to select the documents to be attached that are on the local device (on the computer). Additionally, a description can be added to each document.
Metrics
In the “ Metrics ” option, the measures and values used to define the indicators are defined. By clicking on the metric names' links, options for defining the metrics are accessed.
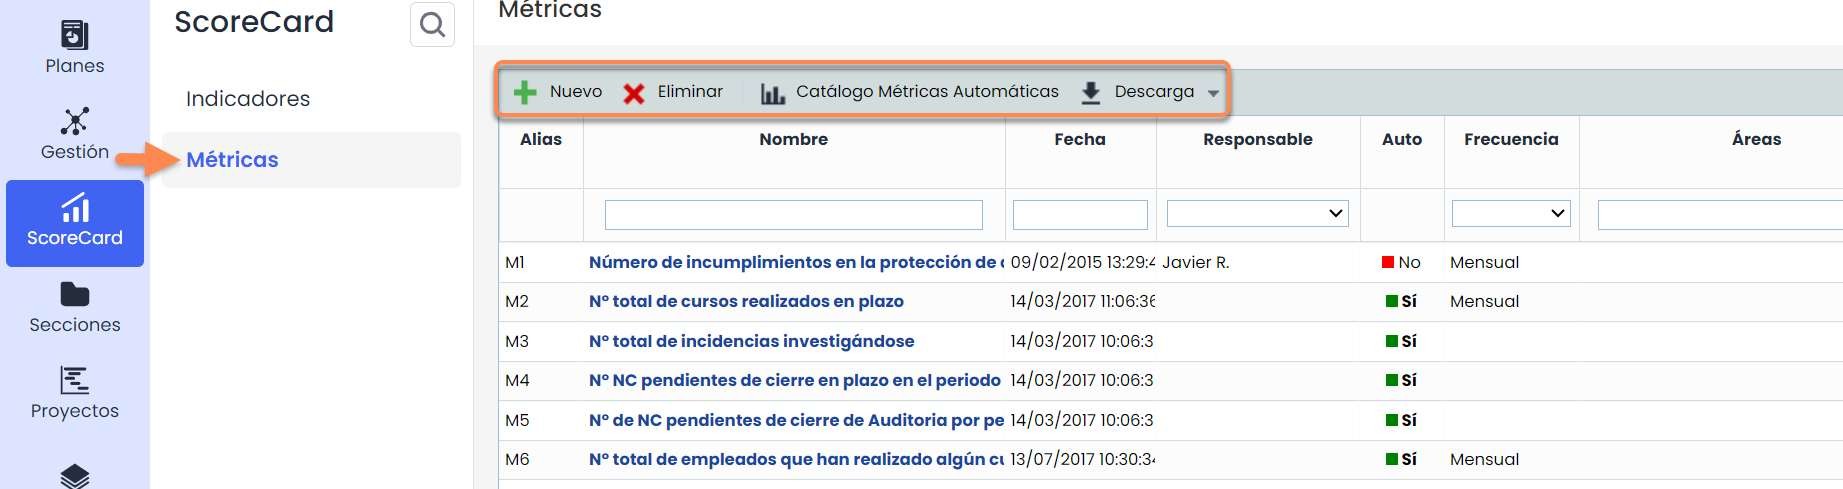
The options provided by the GlobalSuite® tool are:
-
New: Allows generating new Metrics.
-
Delete: Allows deleting Metrics.
-
Automatic Metrics Catalog: List of metrics, distributed by categories, that can be automatically obtained from information recorded in GlobalSuite®.
-
Download: Allows downloading the list of Metrics in different formats.
There are 2 types of metrics:
-
Manual: Consists of creating a metric from scratch, where, depending on the chosen frequency, values must be manually added.
-
Automatic: These are default metrics. In the “ Automatic Metrics Catalog” button, the available ones can be found. The advantage of these metrics is that they collect data directly from GlobalSuite®, so they do not need to be entered manually.
By clicking on one of the created metrics or creating a “ New” one, you access the GlobalSuite® screen that allows characterizing and representing the metric.
Two clearly differentiated parts appear:
-
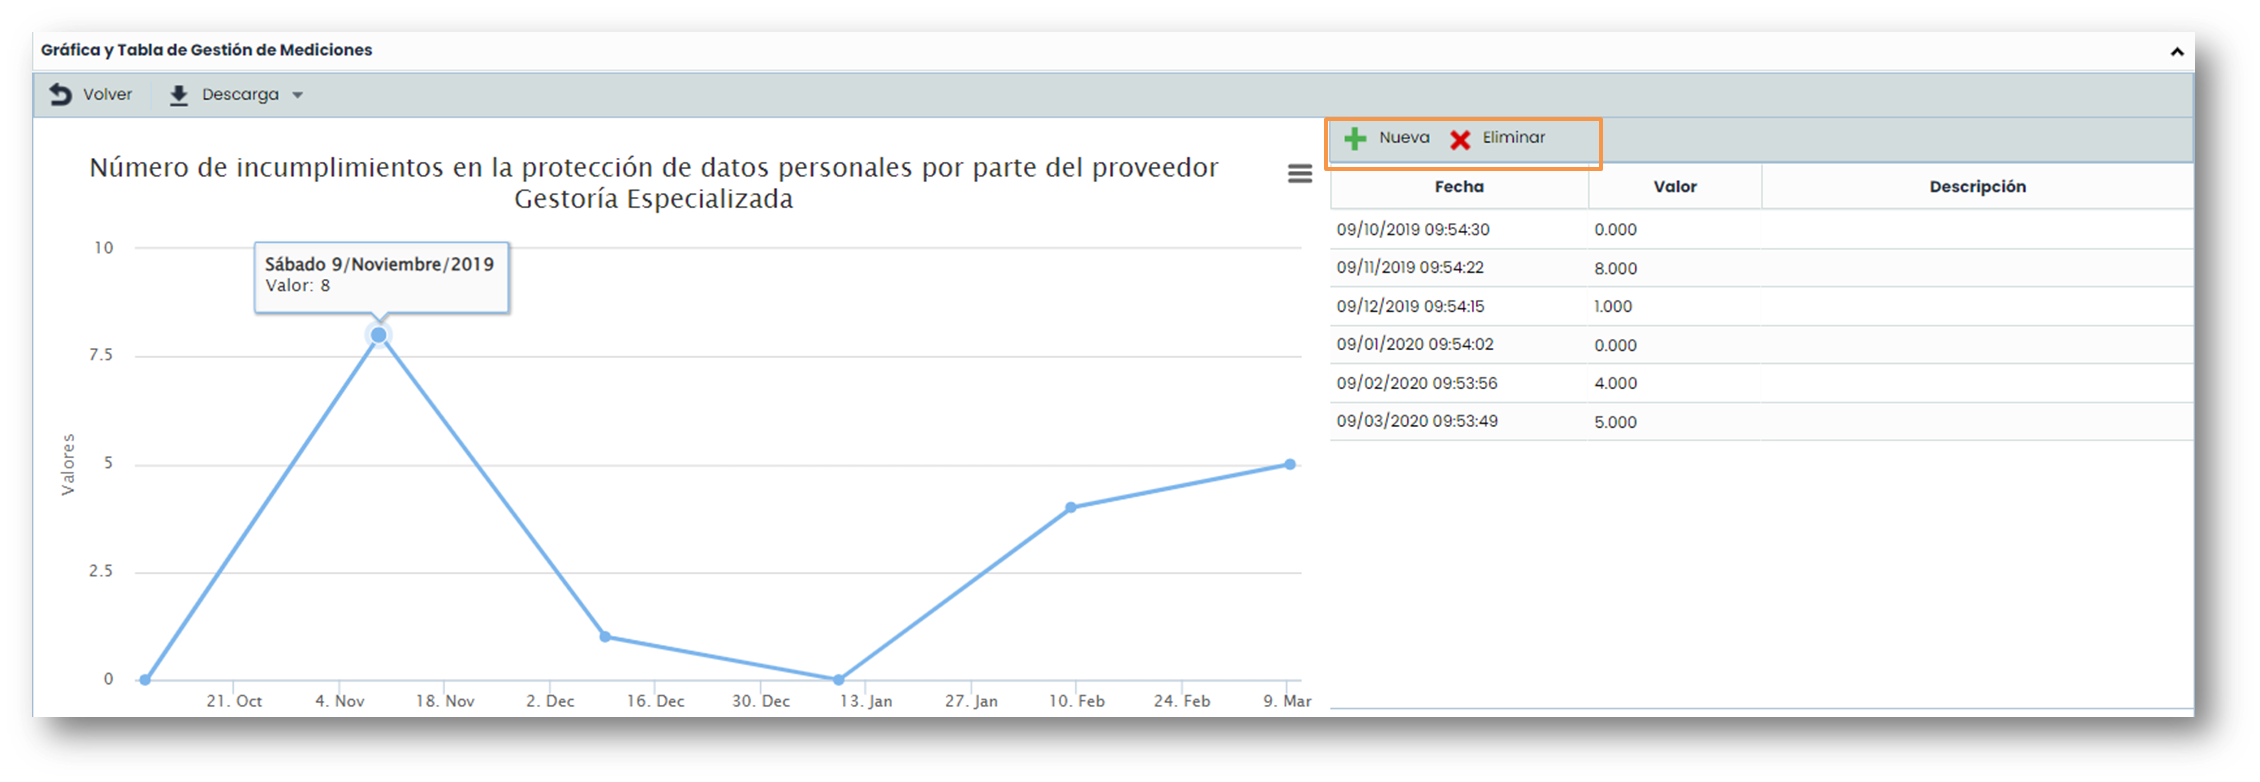
Graph and Measurement Management Table: Allows visualizing the metric values over time.
-
Modify the metric:
-
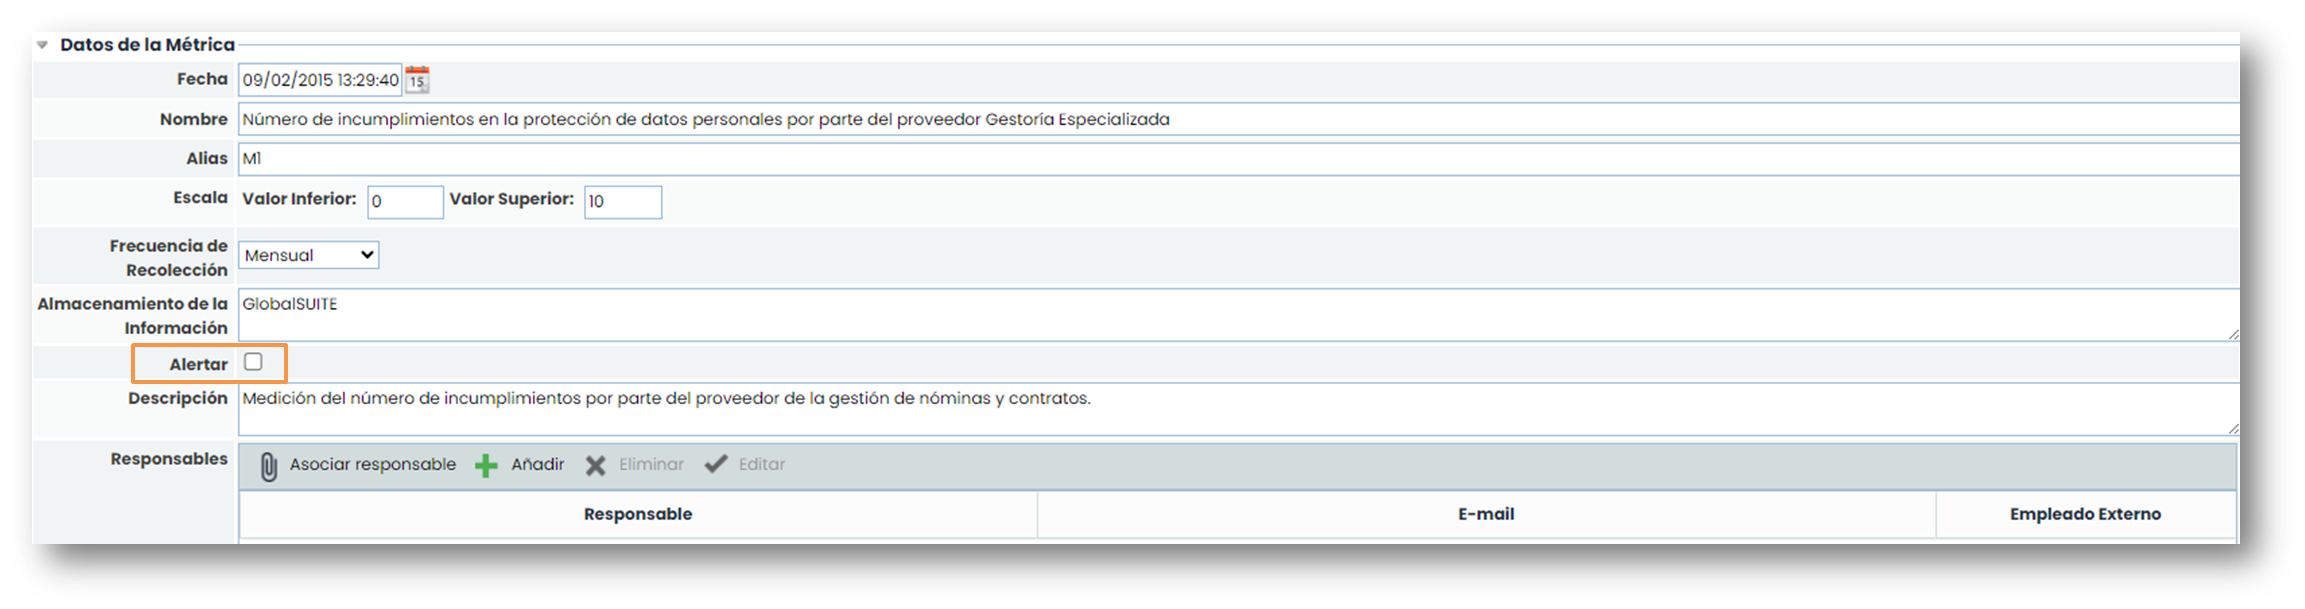
Metric data: Consists of a form where the date, name, frequency, among other available fields, appear. The alert checkbox allows notifying the responsible persons of a metric that they must record a value. These responsible persons are registered in the table below.
-
To associate a metric with an indicator, the collection frequency of both must be the same.
Metrics will be recorded and represented in the Graph and Measurement Management Table. To assign a new value to a metric, the “ New” option must be clicked. To delete a metric's data, the “ Delete” option must be clicked.
The date can be modified by clicking on it, and to modify a value, the value to be modified must be clicked.
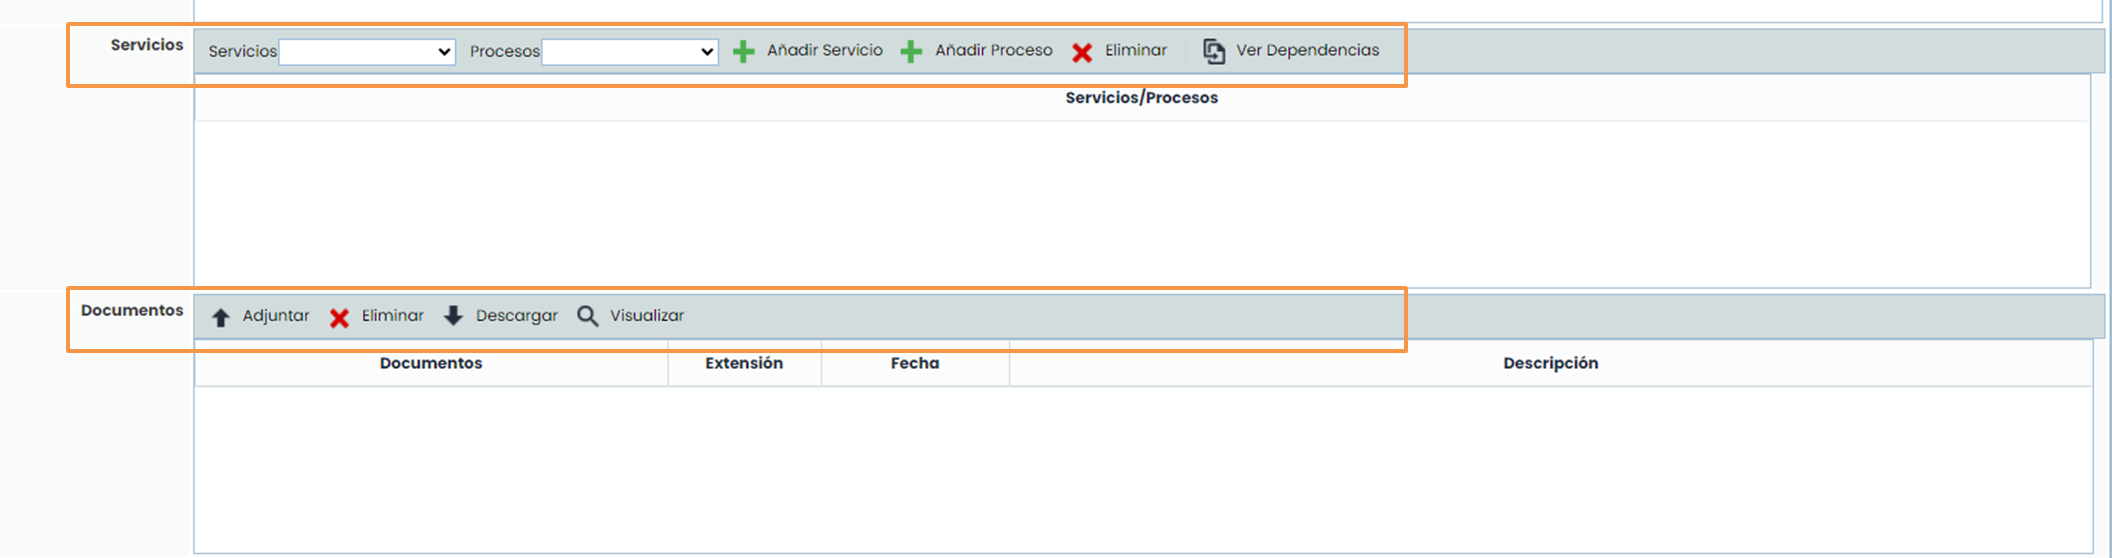
Each metric can be associated with one or more services, one or more processes associated with those services, one or more areas, and one or more documents that serve as evidence of the recorded information.
To associate a process, the service on which that process depends must first be added. Once added, the processes that depend on it can be added.
To upload these documents, click on the “ Attach” button, and a pop-up window will open to select the documents to be attached that are on the local device (on the computer). Additionally, a description can be added to each document.